

HONG KONG / NEW YORK / LONDON — A fundamental regime shift is cascading through global capital markets. According to tracking data published early today by BigGo Finance, global net liquidity flow indicators—which formally peaked in late 2025—have entered a definitive, structural contraction. As central bank balance sheet runoff accelerates and sovereign issuance pressures mount, U.S. Treasury yields have spiked across the curve, repricing risk assets worldwide. Yet, within this broader macro tightening cycle, a sharp divergence has emerged: China’s mainland A-share market is entering a highly specific, policy-buffered tactical rebound window, offering cross-border asset managers a rare asymmetrical risk-reward setup.
EXECUTIVE TAKEAWAYS
- Global Liquidity Peak Confirmed: Macro tracking metrics reveal global liquidity flow indicators crested in late 2025. While total aggregate stock remains elevated, net second-derivative flows are now negative, driven by persistent Federal Reserve balance sheet runoff and relentless U.S. sovereign debt issuance.
- U.S. Yields Break Out: The benchmark U.S. 10-Year Treasury yield has spiked as term premiums expand, tightening global financial conditions and putting compression pressure on Western equity valuation multiples.
- A-Share Tactical Opportunity: Mainland Chinese equities (A-shares) are decoupled from Western liquidity drag due to aggressive, counter-cyclical monetary easing by the People’s Bank of China (PBOC), state fund intervention, and extreme valuation discounts.
- Institutional Reallocation: Global macro funds, corporate treasuries, and sovereign wealth entities are executing targeted cross-border rebalancings to capture short-term A-share mean reversion while mitigating fixed-income duration risk.
The Macro Pivot: Anatomy of the Global Liquidity Contraction
The transition from liquidity expansion to structural deceleration was quietly signaled in late 2025 when aggregate global flow indicators—measuring the net velocity of capital across the G10 central banks, reverse repurchase facilities (RRP), and fiscal bank accounts—turned negative. While the sheer stock of money supply remains historically broad, the second derivative—the rate of net liquidity injection—has collapsed.
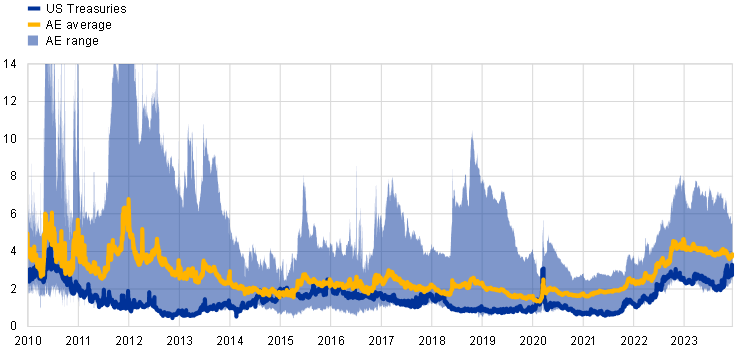
At the center of this contraction is the U.S. sovereign debt market. The U.S. Department of the Treasury's aggressive quarter-refunding schedules, combined with the Federal Reserve’s ongoing balance sheet runoff, have depleted excess cash buffers in the overnight Reverse Repo Facility. Consequently, newly issued Treasury supply must be absorbed directly by primary dealers and commercial bank balance sheets. This dynamic has forced a structural widening of the term premium—the extra yield investors demand for holding long-term debt—driving the 10-year U.S. Treasury yield sharply upward.
This spike in benchmark sovereign risk-free rates radiates globally. Higher U.S. real yields elevate the cost of capital across corporate balance sheets, compress equity valuation multiples, and induce dollar-denominated cross-border liquidity drain from emerging market debt and high-beta equities.
The Real Yield Pressure Gauge
For enterprise financial leaders and institutional allocators, real interest rates (nominal yields minus inflation expectations) are reaching restrictive thresholds. Corporate treasuries are facing heightened refinancing costs, forcing a reprioritization of capital allocation strategies from stock buybacks and aggressive capital expenditures toward liability management, enterprise balance sheet hedging, and high-yielding short-duration paper.
The A-Share Disconnect: Why Mainland China Moves Counter-Cyclically
While Western economies digest higher-for-longer capital costs, China’s financial system is operating on a fundamentally distinct transmission mechanism. The People’s Bank of China (PBOC) has doubled down on counter-cyclical monetary operations, decoupling the mainland market from G10 liquidity headwinds.
Following the structural inflection confirmed by BigGo Finance, mainland A-shares—represented by the CSI 300 and Shanghai Composite indices—are entering a tactical mean-reversion window. This window is built upon three structural pillars:
1. Aggressive Monetary Easing and targeted PBOC Injections
Unlike the Fed, the PBOC is actively expanding its balance sheet through direct open-market operations, targeted Medium-Term Lending Facility (MLF) cuts, and targeted reserve requirement ratio (RRR) reductions. This localized liquidity expansion is explicitly designed to lower sovereign borrowing costs, stabilize the domestic property sector, and revitalize corporate credit demand.
2. Historic Equity Risk Premium (ERP) Differentials
Due to prolonged multi-year derating, China’s Equity Risk Premium (ERP) relative to mainland sovereign debt sits near decade highs. Conversely, the S&P 500’s ERP has compressed to near-zero levels due to elevated U.S. Treasury yields. For institutional value allocators, mainland equities represent one of the few global asset classes where earnings yields significantly exceed risk-free rate benchmarks.
3. State-Backed Capital Allocation and Regulatory Alignment
Domestic institutional liquidity is being systematically channeled into core A-share equities. State-affiliated investment vehicles, colloquially known as the "National Team" (such as Central Huijin Investment), have established persistent floor bids across high-dividend state-owned enterprises (SOEs) and key strategic sectors, including semiconductor fabrication, advanced industrial automation, and green infrastructure scalability.
Quantitative Breakdown: Cross-Border Macro Indicators
The table below provides a granular comparative breakdown of key macro metrics, valuation multiples, and monetary indicators defining the current global liquidity inflection point.
| Macro Benchmark Metric | U.S. / Developed Markets | China A-Share / Mainland Market | Institutional Implications |
|---|---|---|---|
| Liquidity Flow Direction | Contracting (QT + Heavy Issuance) | Expanding (PBOC RRR & Rate Cuts) | Tactical asset rotation from DM to Mainland equities |
| 10-Year Benchmark Yield | Surging (Term Premium Expansion) | Anchored / Moderating | Duration risk in U.S. debt; floor support for A-shares |
| Forward P/E Valuation Multiples | Elevated relative to real rates | Compressed (Historical Discount) | High probability of mean-reversion in A-share valuation |
| Equity Risk Premium (ERP) | Near Historical Lows (~0-1%) | Near Historical Highs (~6-7%) | Unfavorable risk-reward in U.S. vs compelling upside in A-shares |
| Enterprise Capital Allocation Focus | Cost optimization & Debt Refinancing | State-supported Capex & Strategic Tech Expansion | Sectoral rotation toward mainland hardware and energy infrastructure |
Market & Sectoral Implications: Identifying Winners and Losers
As global liquidity contracts and the A-share tactical window opens, institutional investment strategies must pivot from broad-market beta exposure to disciplined, highly targeted sector selection.
Institutional Winners: Tactical Capital Reallocation
- Mainland Hard Tech and Semiconductor Equipment: Benefiting from national self-reliance mandates, companies in advanced cloud compute architecture, lithography components, and AI hardware infrastructure are receiving both policy subsidies and dedicated domestic capital flows.
- High-Dividend State-Owned Enterprises (SOEs): Energy, telecommunications, and state infrastructure providers offer dividend yields between 5% and 8%, serving as crucial defensive cash-flow yield vehicles for sovereign and institutional treasuries.
- Global Fixed-Income Arbitrage Strategies: Macro hedge funds are actively going long short-duration Chinese sovereign bonds while shorting long-end U.S. Treasuries to harvest the widening term premium spread.
Institutional Headwinds: Risk Management Priorities
- High-Beta U.S. Growth Equities: Tech companies with deferred profitability profiles face severe valuation compression as discount rates (driven by surging U.S. Treasuries) rise.
- Highly Leveraged Emerging Market Sovereigns: Emerging economies reliant on dollar-denominated debt face foreign direct investment (FDI) outflows and escalating debt-servicing costs as the U.S. dollar strengthens alongside Treasury yields.
Frequently Asked Questions (People Also Ask)
What does a global liquidity inflection point mean for retail and institutional investors?
A global liquidity inflection point marks a structural transition from money supply expansion to money supply deceleration or contraction. For investors, this typically signals higher borrowing costs, lower valuation multiples for speculative assets, increased financial market volatility, and a market environment where fundamental earnings quality and yield matter significantly more than momentum-driven capital flows.
Why are U.S. Treasury yields surging if central banks are near the end of rate-hike cycles?
U.S. Treasury yields are surging primarily due to a growing supply-demand imbalance rather than rate hike expectations alone. Massive federal budget deficits require unprecedented debt issuance by the U.S. Treasury. Simultaneously, major foreign buyers and the Federal Reserve (via Quantitative Tightening) are scaling back purchases. This forces market primary dealers to demand a higher "term premium" to absorb the oversupply of government bonds.
How can China's A-shares rally when global liquidity is tightening?
China’s domestic financial market operates with a degree of insulation from global capital flows due to capital controls and distinct monetary cycles. While global liquidity tightens, the PBOC is expanding domestic money supply through targeted easing measures. Additionally, Chinese A-share valuations dropped to historic multi-year lows, meaning even modest domestic capital injections or policy shifts can trigger rapid, sharp tactical rebounds (mean-reversion) regardless of Western macro conditions.
What are the primary risks to the A-share tactical rebound scenario?
The primary risks include weaker-than-expected domestic consumer demand inside China, potential escalate-on-arrival geopolitical trade frictions, and delayed transmission of central bank liquidity into real economic corporate earnings. If domestic bank lending fails to expand despite PBOC easing, the tactical equity rally could stall or convert into a range-bound market.
Strategic Outlook: Key Milestones to Watch
Navigating the next two to four quarters requires strict adherence to quantitative liquidity tracking and central bank balance sheet disclosures. Institutional risk managers and corporate treasurers should monitor three pivotal indicators to gauge the longevity of this macro regime shift:
- U.S. Treasury Quarter Refunding Announcements (QRA): Any shift in the ratio of short-term Treasury Bills to long-term Coupon issuance will directly impact the 10-year term premium and broader equity discount rates.
- PBOC Net Open Market Operations & Credit Impulse Data: A sustained expansion in China’s monthly Credit Impulse Index will confirm whether tactical liquidity injections are converting into long-term enterprise capital expenditure and earnings upgrades.
- Cross-Border Clearing & FX Settlement Flows: Tracking RMB-denominated cross-border trade settlements will reveal whether global institutional allocators are expanding their permanent structural exposures to mainland capital markets, bypassing traditional dollar-clearing friction.
Conclusion: The confirmation of the global liquidity peak marks the end of broad-based, tide-lifting asset rallies. In this new phase of market fragmentation, enterprise survival and portfolio alpha depend on dynamic capital reallocation—exploiting localized policy easing in markets like China’s A-shares while maintaining rigorous interest rate hedging across Western exposure.


:max_bytes(150000):strip_icc():focal(749x0:751x2)/catherine-princess-wales-kylie-kelce-100126-2a-55aafd41f076483d905c2d320ce01e62.jpg)