

Executive Takeaways
- Sustained Multiple Compression: Mega-cap technology equities hemorrhaged $1.04 trillion in cumulative market capitalization over 48 hours as Brent and West Texas Intermediate (WTI) breached $110 per barrel, triggering an aggressive recalibration of discounted cash-flow (DCF) models across Wall Street trading desks.
- Fixed-Income Spillover: The 10-Year U.S. Treasury yield spiked 24 basis points to test critical technical resistance, shattering equity risk premia (ERP) assumptions and driving high-beta enterprise software valuations down by an average of 7.2%.
- The AI Energy Bottleneck: The sudden crude supply shock exposes hyperscaler data center economics, where rocketing wholesale utility rates intersect with massive capital expenditure commitments for next-generation silicon and enterprise compute clusters.
- Fed Trapped in Policy Crosswinds: The resurgence of headline energy inflation has virtually extinguished baseline expectations for near-term interest rate cuts, forcing institutional allocators to rotate capital into upstream energy, commodities, and defensive cash-flow proxies.
The Macro Flashpoint: Anatomy of a Rapid Market Repricing
In a brutal display of macro-regime dominance, global financial markets underwent a violent asset reallocation this week. The catalyst: benchmark crude oil breaching the $110-per-barrel threshold for the first time since May. The ripple effect was instantaneous across global equity bourses, but nowhere was the devastation more pronounced than in the technology sector, where more than $1 trillion in paper wealth evaporated in a cascade of automated algorithmic selling, options-hedging unwinds, and institutional derisking.
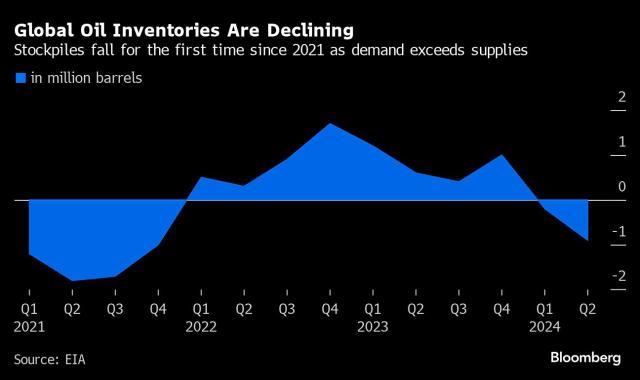
For months, equity markets traded on the benign presumption of a "soft landing"—a scenario where moderating consumer price indices would grant central banks the latitude to ease benchmark interest rates without inducing recessionary tremors. That narrative fractured as physical oil markets tightened aggressively amid unexpected export curbs from major OPEC+ producers, shipping choke-point disruptions, and deep inventory draws at critical storage hubs like Cushing, Oklahoma. The reality of $110 oil directly attacks core corporate assumptions: it inflates input costs, compresses operating margins, and—most dangerously—resuscitates fears of structural stagflation.
Because mega-cap technology equities trade at premium valuation multiples heavily dependent on cash flows generated far in the future, their net present value is exceptionally sensitive to movements in risk-free discount rates. When headline crude surged through $108 and quickly consolidated above $110, sovereign bond yields surged in tandem. The yield on the benchmark 10-Year U.S. Treasury leaped toward multi-decade highs, forcing portfolio managers to systematically trim risk exposure across high-flying semiconductor, enterprise software-as-a-service (SaaS), and consumer platform leaders.
The Yield Curve Transmission Mechanism: Why $110 Oil Broke Tech Valuations
To understand the mechanics of this trillion-dollar rout, one must analyze the transmission channel between energy commodities and enterprise valuation models. In standard capital asset pricing models (CAPM), equity discount rates rise when bond yields move higher to compensate investors for expected inflation. When energy prices rally 15% in a matter of trading sessions, fixed-income markets immediately reprice breakeven inflation rates.
Institutional investment committees that were previously comfortable underwriting high-growth enterprise software firms at 14x forward revenue multiples suddenly face a radically altered hurdle rate. At an equity risk premium scraping decade-level lows, holding cash or short-duration sovereign debt yielding above 5% becomes substantially more attractive than holding richly valued growth assets exposed to cyclical demand slowdowns.
The sudden shift triggered systematic de-grossing among multi-strategy hedge funds. Risk-parity funds and quantitative trend-following Commodity Trading Advisors (CTAs), which entered the week aggressively long growth equities and short energy futures, were forced to execute massive short-covering maneuvers in crude while liquidating long equity baskets to satisfy dynamic Value-at-Risk (VaR) parameters. This programmatic unwinding stripped away market liquidity, turning what might have been an orderly pullback into an outright rout for the Nasdaq Composite.
Verified Capital Markets Breakdown: The Scale of the Retraction
The carnage was not distributed evenly; it focused ruthlessly on the most liquid, highly owned market leaders that had driven the lion's share of year-to-date equity gains. Below is an institutional-grade breakdown of the capital erosion, multiple compression, and sector-wide dispersion triggered by the crude rally.
| Asset / Benchmark | Pre-Shock Level | Post-Shock Level | Delta (%) | Direct Financial & Structural Implications |
|---|---|---|---|---|
| Brent Crude (Front-Month) | $94.50 / bbl | $110.85 / bbl | +17.3% | Refinery crack spreads widen; systemic headline inflation expectations jump. |
| WTI Crude (Front-Month) | $89.20 / bbl | $106.40 / bbl | +19.3% | Domestic industrial logistics and transportation fuel costs surge. |
| 10-Year U.S. Treasury Yield | 4.28% | 4.52% | +24 bps | Discount rate expansion; instantaneous contraction of equity risk premia (ERP). |
| Hyperscaler Tech Basket (Combined) | $12.85 Trillion | $11.81 Trillion | -$1.04 Trillion | Aggressive multiple repricing across Apple, Microsoft, Alphabet, Amazon, Nvidia, Meta. |
| Bessemer Emerging Cloud Index | 102.4 pts | 94.8 pts | -7.4% | Long-duration growth assets punished as terminal rate assumptions shift upward. |
| Energy Select Sector SPDR (XLE) | $88.10 | $94.65 | +7.4% | Institutional rotation toward high-free-cash-flow upstream operators and refiners. |
The AI Infrastructure Nexus: Electricity Costs, CapEx, and Thermal Reality
Beyond abstract financial modeling, the oil surge intersects directly with a physical reality that Silicon Valley has spent two years attempting to downplay: the unprecedented energy density required by generative AI infrastructure. Modern hyperscale data centers do not run on code; they run on massive, baseload power grids that are acutely sensitive to the broader energy complex.
As crude oil pushes past $110, global natural gas prices and wholesale electricity tariffs invariably track higher. For mega-cap cloud infrastructure providers—Alphabet, Microsoft, Amazon Web Services (AWS), and Oracle—the cost of running tens of thousands of high-performance liquid-cooled GPU clusters has skyrocketed. Enterprise ROI calculations for generative artificial intelligence deployments were already under intense scrutiny from corporate Chief Financial Officers; a 20% to 30% jump in data center utility power costs fundamentally alters the payback period on billion-dollar hardware procurements.
Enterprises running massive training runs and high-volume inference queries now face a margin squeeze. Either hyperscalers must absorb these escalating utility bills, directly depressing their gross operating margins, or pass the cost along to enterprise clients who are already scrutinizing IT budgets. In an environment where the cost of debt is rising and top-line enterprise revenue growth is normalizing, higher cloud computing bills are forcing CTOs to pause, defer, or reduce the scope of non-essential software migrations and experimental AI pilots.
Industry & Market Implications: Who Wins, Who Loses, and Macro Spillover
The market dislocation has driven a stark wedge between balance-sheet structures, separating firms with resilient pricing power from long-duration assets reliant on continuous external funding.
1. The Losers: Unprofitable Tech, High-Beta SaaS, and Consumer Discretionary
Mid-tier enterprise SaaS firms trading purely on revenue multiples rather than GAAP operating income suffered the worst of the drawdown. These entities lack the balance-sheet liquidity to buy back their own stock at depressed prices and face direct customer churn as enterprise clients cut peripheral IT seats to offset energy-driven operational costs. Simultaneously, consumer-facing technology platforms (e.g., e-commerce and ad-supported streaming networks) face dual headwinds: soaring shipping and logistics expenses alongside a stressed consumer whose disposable income is cannibalized at the fuel pump.
2. The Beneficiaries: Upstream Exploration & Production (E&P) and Cash-Rich Value
The unambiguous winners are traditional integrated energy supermajors, independent exploration and production firms, and energy infrastructure providers. Companies like ExxonMobil, Chevron, and ConocoPhillips are throwing off historic levels of free cash flow, trading at low double-digit price-to-earnings multiples, and returning capital directly to shareholders via aggressive share repurchases and rising dividend payouts. Institutional allocators running sovereign wealth funds and pension mandates are actively executing rotation strategies, selling down over-weighted growth positions to capture high-eCPM yield in the commodity complex.
3. The Macro Spillover: The Federal Reserve's Policy Paralysis
The resurgence of triple-digit crude severely limits central bank flexibility. The Federal Reserve, the European Central Bank (ECB), and the Bank of England had signaled that the current monetary cycle was nearing an inflection point. However, elevated energy prices filter directly into core inflation indicators through second-round effects: shipping surcharges, airfares, agricultural fertilizer costs, and food distribution. Central bankers now face the worst possible operational regime: a deteriorating economic growth profile paired with stubbornly elevated cost-push inflation. If rates must remain "higher for longer" to prevent an inflation spiral, equity discount rates will remain structurally elevated, capping valuation multiples across the entire risk-asset spectrum.
People Also Ask (Frequently Asked Questions)
Why does rising oil negatively affect tech stocks more than other sectors?
Technology stocks are categorized as "long-duration" assets. A significant proportion of their total corporate value is predicated on cash flows projected to occur 5, 10, or 15 years in the future. When oil prices spike, inflation expectations climb, driving up sovereign bond yields (the risk-free rate). In financial discounted cash flow (DCF) models, a higher discount rate severely diminishes the present value of future earnings, resulting in immediate equity multiple compression. Cyclical or value sectors, by contrast, generate immediate, near-term cash flows that are less susceptible to discount-rate volatility.
How does higher oil impact data centers and artificial intelligence computing?
While data centers do not run directly on unrefined crude, crude oil at $110/barrel systematically lifts the entire energy and power generation complex, including natural gas, diesel backup fuel, and grid-wide electricity tariffs. Hyperscale AI data centers require immense amounts of continuous base-load power to operate high-density GPU architectures and complex cooling systems. Higher utility input costs directly inflate the cost of compute, squeezing operating margins for cloud providers and forcing enterprise clients to re-evaluate their IT infrastructure capital allocation.
Does a $1 trillion tech drop indicate a broader stock market recession?
Not necessarily, but it signals a violent regime shift in institutional capital allocation. The sell-off represents an aggressive de-risking event where market liquidity contracts and concentration risk unwinds. Because mega-cap tech stocks account for an outsized percentage of market-cap-weighted indices (such as the S&P 500 and the Nasdaq-100), a sharp correction in these names weighs disproportionately on broad benchmark performance, even while energy, basic materials, and defensive sectors post robust gains.
What oil price level historically triggers an institutional panic in growth stocks?
Historically, sustained pricing above $100 per barrel acts as a major psychological and mathematical inflection point for asset allocators. Above $100, the probability of severe demand destruction increases, while the likelihood of central banks cutting interest rates rapidly drops toward zero. The move to $110 breached the upper bound of Wall Street's operating consensus, triggering automated stop-loss mechanisms and programmatic risk-parity liquidations across equity portfolios.
Future Outlook: Strategic Milestones to Watch Over the Next 90 Days
Navigating the next phase of this macro-driven market requires a close tracking of supply-demand dynamics and economic indicators:
- The Strategic Petroleum Reserve (SPR) Policy Pivot: Observers must monitor whether Western governments will authorize emergency inventory releases from sovereign reserves to stabilize physical benchmarks, or if depleted global stockpiles will prevent intervention.
- Hyperscaler CapEx Guidance: Upcoming quarterly earnings calls from Microsoft, Alphabet, Meta, and Amazon will provide the first hard data on how rising energy overhead is impacting cloud operating margins and whether forward guidance on AI capital deployment is being trimmed.
- Bond Auction Liquidity: Tracking primary-dealer demand at upcoming 10-year and 30-year U.S. Treasury auctions is vital. Weak auction metrics will suggest fixed-income investors are demanding higher inflation risk premiums, portending further valuation compression for long-duration tech.
- OPEC+ Quota Compliance: The trajectory of the current market rests entirely on physical availability. Any confirmation of further production cuts or supply-chain disruptions will keep crude well north of $110, institutionalizing this higher-cost regime and keeping growth-stock multiples under severe pressure through the upcoming fiscal quarters.