Executive Takeaways
Test Our Free AI & Tech Utilities Suite
Calculate LLM API token costs, analyze article dwell-time, or simulate tech DCA returns.
- Blended Gross Margin Expectations: Global equity desks and institutional portfolio managers are focusing on Apple Inc.’s (NASDAQ: AAPL) gross margin trajectory—projected by consensus models between 45.5% and 46.5%—as the ultimate test of the tech giant’s pricing power amid rising component costs.
- The Services Counterweight: Expansion in Apple’s high-margin Services division (boasting gross margins near 74%) continues to offset hardware margin compression caused by elevated DRAM/NAND memory prices and TSMC’s advanced 3-nanometer silicon wafer costs.
- Pro-Tier Premiumization Strategy: Average Selling Price (ASP) tailwinds, driven by consumer migration toward higher-tier iPhone Pro and Pro Max variants, remain critical for absorbing increased Bill-of-Materials (BOM) expenses and supply chain restructuring CAPEX in India and Vietnam.
- Regulatory Margin Risks: While capital allocation via share repurchases supports earnings-per-share (EPS) growth, pending antitrust actions in the EU and US target high-margin revenue streams, including Google’s multi-billion-dollar default search engine licensing agreement.
The Morning Bid Catalyst: Margin Relief as Wall Street’s Ultimate Valuation Anchor

As global capital markets digest shifting macroeconomic signals and interest rate paths, trading desks across New York, London, and Tokyo are fixated on a central catalyst: the structural integrity of Apple Inc.’s gross margins. In morning trading notes circulating among institutional desks, the sentiment is clear—equity markets are seeking explicit relief in Apple’s margin guidance to justify premium forward valuation multiples hovering around 30 times earnings.
For decades, Apple’s enterprise story was evaluated primarily through the lens of hardware unit volume growth. Today, institutional investors treat the Cupertino-based giant as a high-margin recurring cash flow machine. The key metric driving market confidence is no longer just how many devices ship, but the overall revenue mix optimization between Hardware (iPhone, Mac, iPad, Wearables) and Services (App Store, iCloud, Apple Pay, Licensing, and Subscriptions).
With hardware revenue growth moderating across global smartphone markets, gross margin relief has become the fundamental anchor for Apple’s multi-trillion-dollar market capitalization. If Apple can maintain or expand its consolidated gross margin profile above historical baselines, it provides the operating leverage required to generate record free cash flow, support its relentless capital return program, and absorb macroeconomic volatility in key markets such as Greater China.
The Hardware Dilemma: Component Cost Pressures vs. Premium ASP Elevation
Analyzing Apple’s hardware cost architecture reveals a complex tug-of-war between inflationary supply chain forces and corporate pricing execution. Over the past four quarters, Apple’s Bill-of-Materials (BOM) for flagship devices has experienced upward cost pressure from several critical vectors:
- Advanced Semiconductor Wafers: Apple’s push into custom silicon—specifically the A17/A18 Pro chips and M-series architecture built on TSMC’s 3-nanometer (N3B and N3E) process nodes—comes with significantly higher wafer costs compared to legacy 5nm nodes. TSMC’s premium pricing for leading-edge node capacity has raised the unit cost of Apple’s central processing units.
- Memory Price Recovery: A cyclical turnaround in memory markets has driven spot and contract prices higher for high-density mobile DRAM and NAND flash storage. Memory modules, which had provided cost relief during previous industry downcycles, have reverted into a gross margin headwind.
- Premium Industrial Materials: The integration of Grade 5 titanium frames, capacitive haptic controls, and advanced periscope telephoto lens systems has added incremental dollar costs per unit on top-tier devices.
To defend its hardware gross margins—historically anchored between 36% and 38%—Apple relies on an aggressive "premiumization" strategy. By widening the feature gap between base iPhone models and Pro/Pro Max iterations, Apple successfully drives consumer demand toward higher-priced inventory. This mix shift elevates the overall Average Selling Price (ASP), effectively neutralizing rising hardware COGS (Cost of Goods Sold).
Furthermore, Apple’s ongoing supply chain footprint diversification—expanding manufacturing operations in India, Vietnam, and alternative Southeast Asian nodes—introduces short-term capital expenditures and logistics friction. However, institutional analysts view this operational restructuring as essential risk mitigation against localized geopolitical dispatches and tariffs, securing supply chain resilience over a multi-year horizon.
The Services Engine: The High-Margin Shield Protecting Enterprise Cash Flow
The secondary, yet dominant, narrative driving market expectations is the expanding scale of Apple’s Services ecosystem. Generating gross margins consistently between 72% and 75%, the Services segment acts as an economic stabilizer, insulating the consolidated P&L from hardware margin volatility.
As the installed base of active Apple devices scales past 2.2 billion units worldwide, monetization per user continues to compound. High-margin subscription offerings—including iCloud storage tiers, AppleCare, Apple Music, and Arcade—require minimal marginal distribution costs, generating high operating leverage. This shift in corporate cash flow mix systematically pulls Apple’s overall corporate gross margin upward over time.
Financial & Operating Metrics: Apple Margin Architecture & Valuation Trends
| Financial Metric / KPI | FY 2021 Realized | FY 2023 Realized | Current TTM / Consensus Est. | Strategic & Margin Impact |
|---|---|---|---|---|
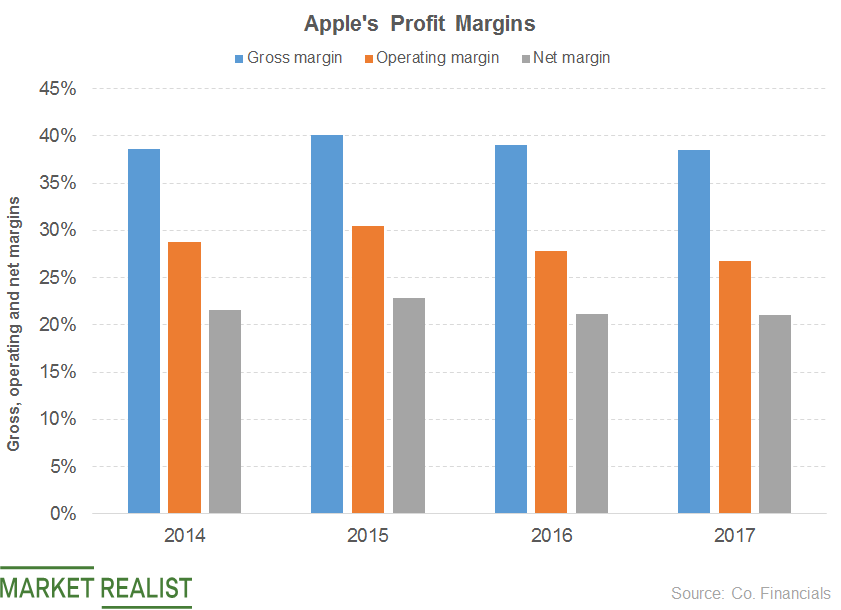
| Consolidated Gross Margin | 41.8% | 44.1% | 45.8% - 46.2% | Driven higher by Services expansion and premium product mix. |
| Hardware Gross Margin | 35.3% | 36.5% | 37.0% - 37.5% | Protected by iPhone Pro mix elevation despite rising 3nm wafer costs. |
| Services Gross Margin | 69.7% | 70.8% | 73.5% - 74.5% | Scale economies across digital storefronts and subscription platforms. |
| Services Share of Total Revenue | 18.7% | 22.2% | 25.0% - 26.5% | Accelerating overall enterprise structural profitability shift. |
| iPhone Average Selling Price (ASP) | ~$825 | ~$895 | ~$925 - $945 | Consumers trading up to flagship Pro Max configurations. |
| Annual Share Buyback Deployment | $85.5 Billion | $77.5 Billion | $90.0B+ Target | Supports EPS growth and capital allocation returns. |
However, equity analysts remain laser-focused on potential margin headwinds originating from global regulatory scrutiny. The European Union’s Digital Markets Act (DMA) forces structural alterations to App Store fee models, while the US Department of Justice’s antitrust action poses a long-term threat to high-margin licensing streams—most notably the multi-billion-dollar annual payments received from Alphabet Inc. for default search engine placement on iOS devices. Because licensing payments carry near 100% gross margins, any regulatory enforcement that scales back these arrangements directly impacts net operating margins.
Industry & Market Implications: Winners, Losers, and Systemic Risk
The broader financial markets care deeply about Apple’s margin outcomes due to the stock’s outsized weight in major benchmark indices, including the S&P 500 and the Nasdaq 100. Margin expansion at Apple provides systemic support for broad equity valuations, while margin compression risks triggering sector-wide pullbacks.
Market Winners
- Leading Semiconductor Foundries: TSMC benefits directly from Apple’s commitment to premium, custom 3nm and 2nm architecture, ensuring strong fab utilization rates and high pricing power.
- Institutional Long-Only Funds: Asset managers seeking capital preservation combined with exposure to enterprise software-like margins benefit as Apple transitions deeper into a Services-led financial model.
- High-End Component Suppliers: Advanced display manufacturers (OLED with variable refresh rates) and specialized optical camera assembly suppliers maintain strong pricing power due to Apple's focus on high-end hardware differentiation.
Market Losers & Vulnerable Counterparties
- Commoditized Hardware OEMs: Tier-2 smartphone manufacturers operating on Android lack Apple's ecosystem lock-in and high-margin services cushion, leaving them exposed to rising memory costs without pricing leverage.
- Second-Tier Component Suppliers: Vendors supplying non-differentiated components face persistent margin pressure from Apple’s procurement team, which aggressively negotiates cost down-cuts to fund internal R&D and preserve hardware gross margins.
People Also Ask (Frequently Asked Questions)
Why are Apple's gross margins so crucial for global stock market health?
Apple represents one of the largest weightings in broad market indexes like the S&P 500 and Nasdaq-100. Because its financial health influences institutional risk appetite, consistent gross margin expansion signals that major consumer tech sub-sectors retain pricing power despite broader inflation or high interest rates. Margin relief at Apple frequently sparks rally dynamics across the broader technology asset class.
How does the shift toward iPhone Pro models affect profitability?
The iPhone Pro and Pro Max configurations command significantly higher gross margins than base models. While premium components like titanium frames and advanced camera systems raise the manufacturing Bill-of-Materials (BOM), the retail price jump (often $200 to $400 higher) more than compensates for the cost increase. This high-margin revenue mix lifts Apple’s hardware gross margin baseline.
What structural risks do antitrust lawsuits pose to Apple’s Services margin?
The most immediate financial risk stems from potential disruption to high-margin licensing agreements, such as Google paying Apple an estimated $15 billion to $20 billion annually to remain the default search engine on iOS. These revenue streams carry virtually no incremental Cost of Goods Sold (COGS). If regulatory rulings invalidate or reduce these agreements, Apple’s Services gross margin would experience immediate structural compression.
How does Apple’s in-house silicon transition defend hardware margins?
By replacing third-party processors (such as Intel chips in Macs) with proprietary M-series and A-series silicon, Apple captures the margin premium historically retained by chip manufacturers. Owning the silicon design pipeline allows Apple to optimize hardware-software integration tightly, control component spend, and achieve structural cost advantages over competitors reliant on commercial off-the-shelf processor architectures.
Future Outlook: Catalysts and Strategic Milestones to Watch
Looking ahead over the next 12 to 24 months, Apple’s gross margin profile will depend on several critical operational and technological milestones:
First, the commercial deployment and monetization of Apple Intelligence—the company's proprietary on-device and cloud-based generative AI platform—will test capital efficiency. If Apple can process complex AI workloads locally on-device via neural processing units (NPUs), it avoids the massive cloud infrastructure maintenance CAPEX currently weighing on hyper-scaler competitors. Any server-side AI processing done via Private Cloud Compute must be managed efficiently to avoid diluting Services gross margins.
Second, Wall Street will closely monitor the pricing strategy for future hardware releases. If component inflation persists, Apple may be forced to implement nominal across-the-board price hikes on base hardware tiers. The market's reaction to such pricing moves will test consumer price elasticity, especially in price-sensitive international markets.
Finally, Apple’s high-volume share repurchase execution remains a vital tailwind for per-share earnings metrics. With a target of maintaining a cash-neutral balance sheet over time, Apple continues to deploy tens of billions annually into share buybacks. Defending enterprise gross margins ensures that free cash flow conversion remains high enough to fund both strategic R&D investments and capital returns to shareholders uninterrupted.