

WARSH’S SHOCK HAWKISH TURN: Fed Chair Orders Surprise Rate Hike—Why 36 Years of History Signal a Violent Shift for Stocks
NEW YORK & MUMBAI — In a move that caught Wall Street entirely off guard, Federal Reserve Chairman Kevin Warsh and the Federal Open Market Committee (FOMC) have delivered a decisive interest rate hike, shattering months of market complacency. Citing stubborn structural inflation and an unexpectedly resilient labor market, the Fed lifted its benchmark federal funds rate by 25 basis points to a fresh target range, signaling that the central bank is far from finished with its monetary tightening campaign.
The announcement sent shockwaves through global exchanges, prompting an immediate spike in the 10-year Treasury yield and a sharp pullback in high-beta growth stocks. For investors scrambling to navigate this sudden hawkish pivot, history is the ultimate guide. According to an exhaustive analysis of macroeconomic data spanning the last 36 years, this specific type of mid-cycle policy escalation triggers a highly predictable, violent rotation across the equity landscape. Here is what the historical playbook reveals about what comes next for your portfolio.
The Decision: Why Fed Chair Kevin Warsh Pulled the Trigger
For weeks, consensus expectations pointed to a prolonged pause, with many traders pricing in eventual rate cuts. However, Chairman Warsh’s address from the press room podium made it clear that the central bank is prioritizing long-term price stability over short-term market enthusiasm.
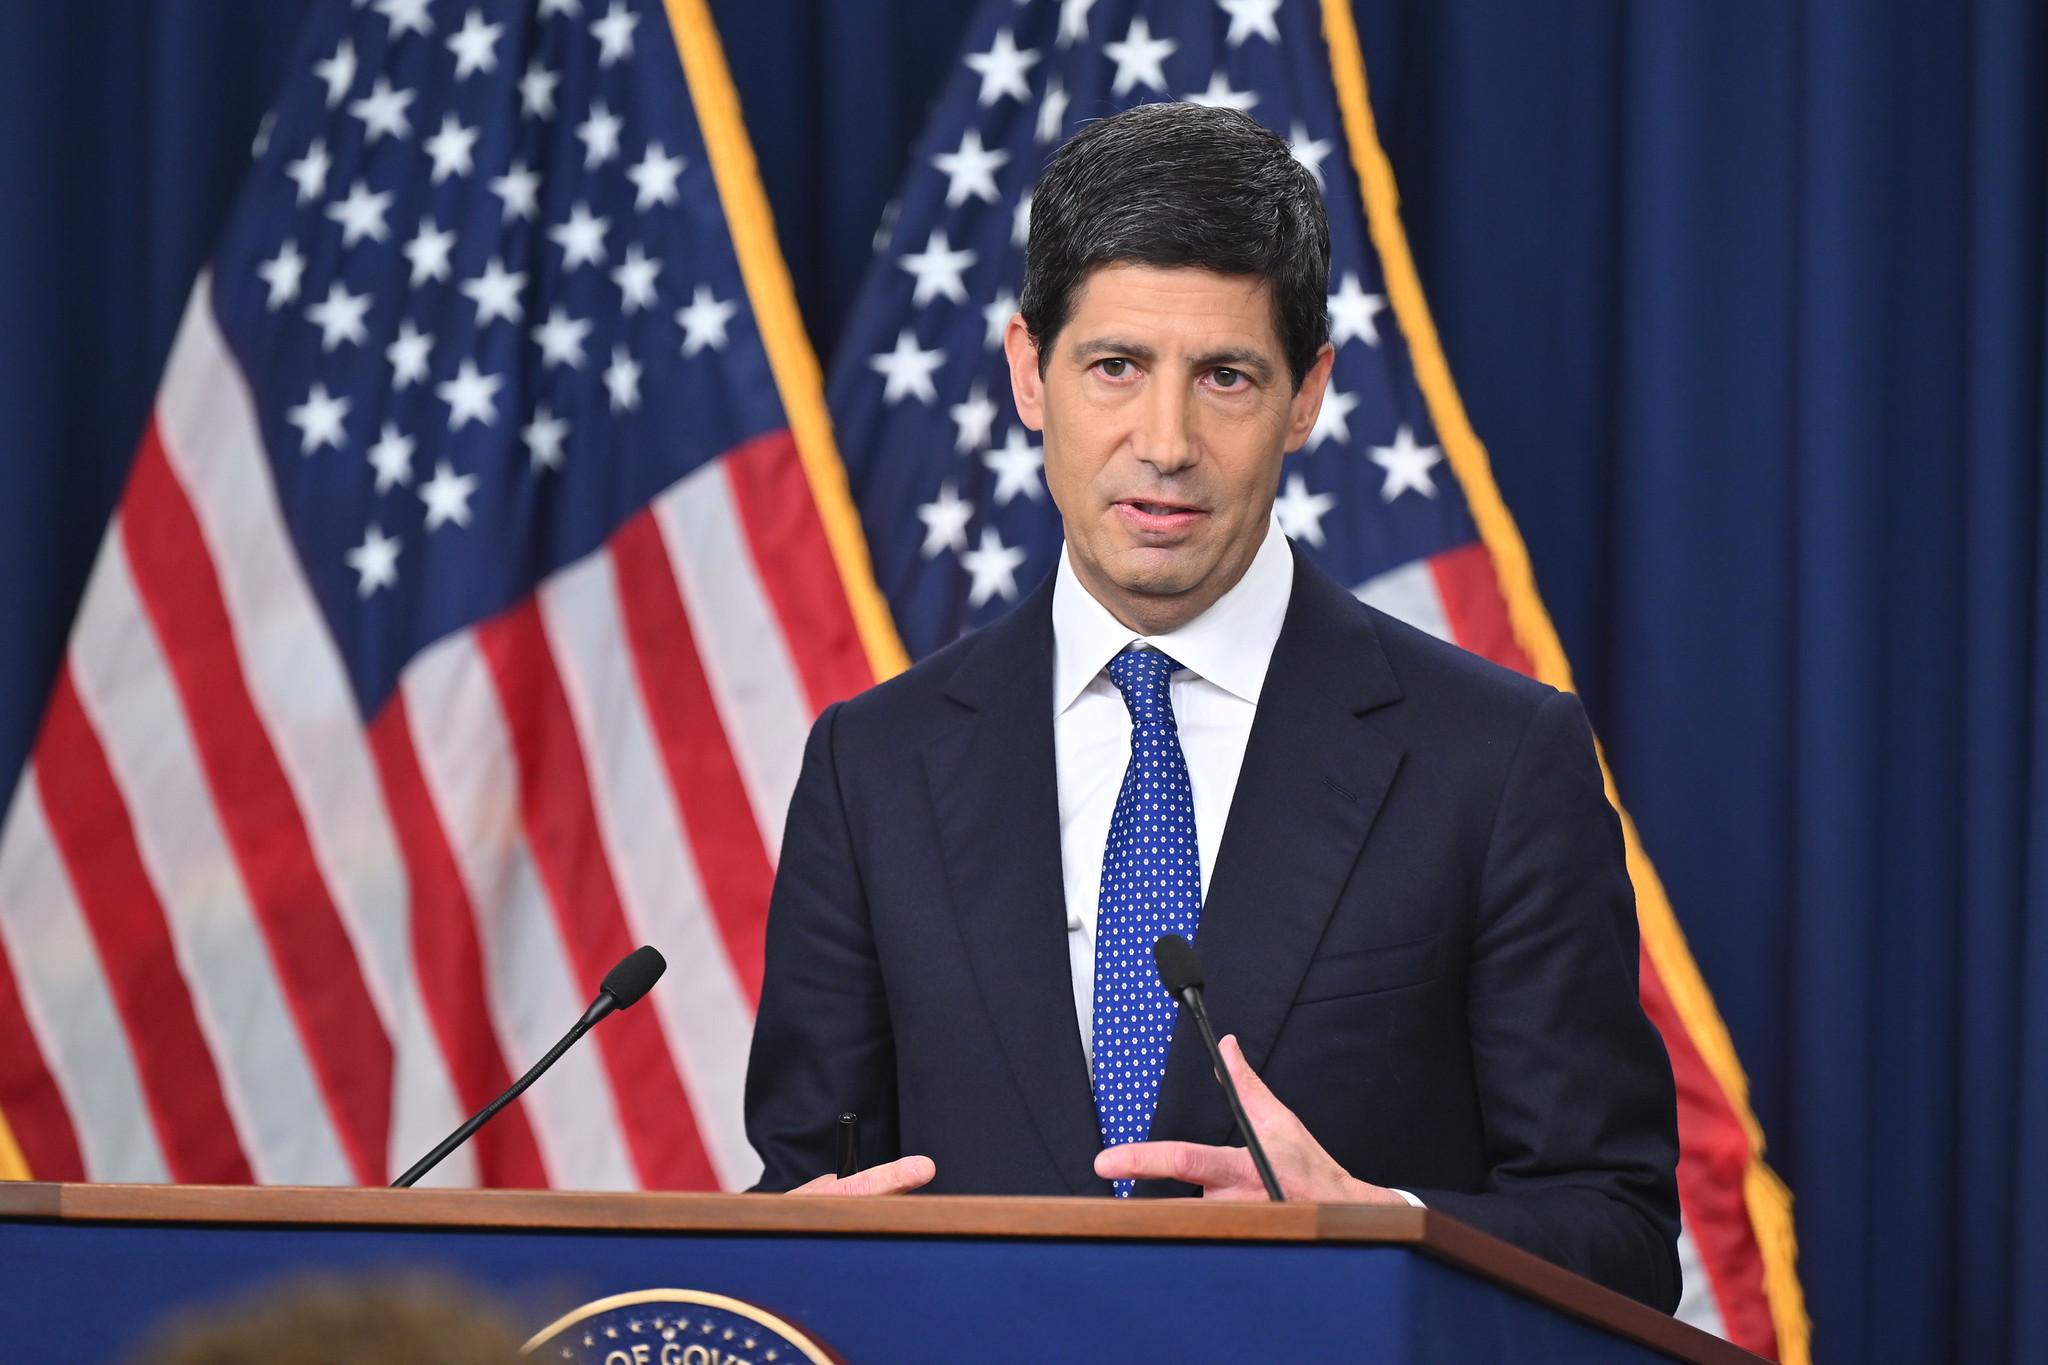
“Complacency is the gravest threat to inflation containment,” Warsh stated during his press conference. “While economic growth remains robust, we continue to see persistent price pressures in services and logistics. The FOMC will not hesitate to act restrictively to ensure inflation trends durably back to our 2% objective. Our policy remains data-dependent, but today’s action reflects our resolve.”
The FOMC’s statement highlighted several key factors driving the decision:
- Unyielding Core Inflation: Sticky shelter and services data have prevented core CPI from cooling to target levels.
- Labor Market Tightness: Despite minor cooling in manufacturing, service-sector wage growth remains uncomfortably high.
- Financial Conditions: Looser financial conditions earlier in the quarter had effectively undone previous tightening, forcing the Fed's hand to re-assert control.
The 36-Year Historical Playbook: What Happens Next?
To understand the market’s trajectory, analysts at major investment banks have turned to historical precedents. Looking back 36 years—to the pivotal rate-hiking cycle of 1988 under Alan Greenspan—reveals a striking pattern. When an established or newly aggressive Fed hikes rates into a mature economic expansion, the immediate reaction of the stock market is rarely a straight line down; rather, it is a period of intense sector dispersion.
Historically, when the Fed executes a "hawkish surprise" during an ongoing expansion, the market undergoes three distinct phases:
Phase 1: The Initial Valuation Multiple Compression (Months 1–3). High-valuation sectors, particularly technology and growth stocks trading at elevated price-to-earnings (P/E) multiples, face immediate downward pressure as discount rates rise. Long-duration assets are re-priced rapidly.
Phase 2: The Quality and Value Rotation (Months 3–6). Cash-flow-rich, low-debt companies in defensive and cyclical sectors—such as Financials, Energy, and Industrials—begin to outperform. Investors prioritize near-term earnings over distant growth promises.
Phase 3: The Divergence of the "Soft vs. Hard" Landing (Months 6–12). History shows that if the economy avoids a recession, equities eventually regain their footing and push to new highs led by value and cyclical sectors. However, if yield curve inversion deepens, a broader market drawdown commences.
Historical S&P 500 Performance Post-Hawkish Surprises
The table below outlines key historical Fed tightening cycles over the last 36 years and how the S&P 500 reacted over the subsequent 3, 6, and 12 months:
| Tightening Cycle Start / Peak | Macroeconomic Context | S&P 500 (3 Months Later) | S&P 500 (6 Months Later) | S&P 500 (12 Months Later) |
|---|---|---|---|---|
| 1988 – 1989 | Greenspan combats post-crash inflation | +3.2% | +7.8% | +16.5% |
| 1994 – 1995 | "Great Bond Massacre" / Aggressive Hikes | -3.1% | -1.2% | +9.4% |
| 1999 – 2000 | Dot-Com Bubble tightening | +2.4% | -1.5% | -12.2% |
| 2004 – 2006 | "Measured" 17-consecutive hikes | +1.1% | +4.8% | +6.3% |
| 2015 – 2018 | Post-ZIRP normalization phase | -2.4% | +2.1% | +8.9% |
| 2022 – 2023 | Aggressive post-pandemic tightening | -4.6% | -8.9% | +11.2% |
The Wall Street Playbook: Where to Position Capital Now
With Chairman Warsh signaling that rates will remain "higher for longer," portfolio managers are actively restructuring their allocations. Institutional desks are leaning heavily into three distinct strategies:
1. Overweighting "Hard Asset" and High-Yield Sectors: Energy and Materials historically act as excellent hedges against persistent inflation, especially when supported by tight physical supplies.
2. Embracing Financials: Banks and insurance companies stand to benefit from a steeper yield curve and wider net interest margins, provided credit defaults remain low.
3. Reducing Exposure to Ultra-High P/E Tech: Companies relying on long-term growth projections with minimal current cash flow are highly vulnerable to rising discount rates. Investors are rotating into large-cap tech behemoths with fortress balance sheets and robust buyback programs.
The Bottom Line
Fed Chair Kevin Warsh has drawn a line in the sand. By prioritizing inflation fighting over market comfort, the FOMC has set the stage for a regime change in equity markets. While the initial reaction may feature elevated volatility, 36 years of financial history suggest that this is not the death knell for the bull market. Instead, it is a loud whistle-blower marking the end of easy-money dominance and the return of fundamental, value-driven stock selection.
Frequently Asked Questions (FAQ)
Q1: Why did the FOMC decide to hike rates now instead of pausing?
A: The FOMC, led by Chairman Kevin Warsh, acted to counter persistent structural inflation in the services sector and prevent financial conditions from loosening prematurely. The committee determined that a preemptive strike was necessary to anchor long-term inflation expectations before wage-price pressures could solidify.
Q2: How should retail investors adjust their portfolios based on the 36-year historical data?
A: Historical trends suggest reducing exposure to highly leveraged growth companies and allocating capital toward "quality" stocks with strong cash flows, high dividend yields, and low debt-to-equity ratios. Sectors like Financials, Energy, and consumer staples typically show resilience and outperform in the months following a hawkish monetary pivot.