

Executive Takeaways
- Escalating Stakes: The Powerball jackpot has surged to an estimated $835 million, driving unprecedented ticket volume and capital influx across state-sanctioned retail nodes.
- Major New Jersey Wins: Retail auditing confirms a single $200,000 ticket alongside two $50,000 winning stubs were recently purchased in New Jersey, highlighting the asymmetric distribution of lottery yields.
- Infrastructure and Scale: Behind the multi-state lottery draw lies a complex web of transaction processing, cloud compute architecture, and state regulatory compliance designed to manage multi-billion-dollar liquidity pools.
- Annuity versus cash lump-sum selections continue to dictate sophisticated wealth management strategies for winners navigating high-bracket tax liabilities.
NEW YORK & TRENTON — As the Powerball multi-state lottery jackpot swells to an astronomical $835 million, retail networks across the United States are experiencing a surge in consumer transaction volume reminiscent of peak institutional trading days. Nowhere is this phenomenon more acute than in New Jersey, where recent auditing data reveals a lucrative flurry of high-tier wins: one ticket securing a staggering $200,000 payout, complemented by two separate $50,000 winning vouchers.
While the cultural narrative surrounding the national lottery often centers on dreams of instantaneous wealth, a rigorous financial and structural analysis reveals a sophisticated, highly regulated enterprise. Operating at the intersection of state taxation, consumer behavior, and high-volume transaction processing, modern lottery systems represent a unique fiscal instrument. This investigative report examines the mechanics behind the $835 million surge, the specific New Jersey retail footprint, and the broader economic implications of America’s most popular game of chance.
The Catalytic Surge: Anatomy of an $835 Million Jackpot
Test Our Free AI & Tech Utilities Suite
Calculate LLM API token costs, analyze article dwell-time, or simulate tech DCA returns.
The escalation of the Powerball jackpot from modest multi-million-dollar resets to jaw-dropping valuations exceeding three-quarters of a billion dollars is not accidental. It is the direct result of deliberate rule modifications implemented by the Multi-State Lottery Association (MUSL) designed to decrease winning probabilities while lengthening rollover cycles.
By widening the odds of hitting the grand prize to roughly 1 in 292.2 million, the system ensures frequent rollovers. Each rollover compounds consumer interest, driving exponential spikes in ticket sales. This surge mimics a classic liquidity cascade in financial markets, where surging momentum attracts capital allocation from a broader demographic base—ranging from casual convenience store buyers to syndicates pooling tens of thousands of dollars.
As the prize pool scales toward the $1 billion threshold, infrastructure scalability is tested. State lottery commissions rely on robust point-of-sale (POS) networks and centralized cloud compute architecture to handle millions of concurrent queries and transaction requests per minute. System downtime during the final hours before a drawing could result in millions of dollars in unrealized state revenue and public backlash, making risk mitigation and network redundancy top priorities for lottery operators.
New Jersey’s High-Yield Footprint: Breaking Down the $300K Trifecta
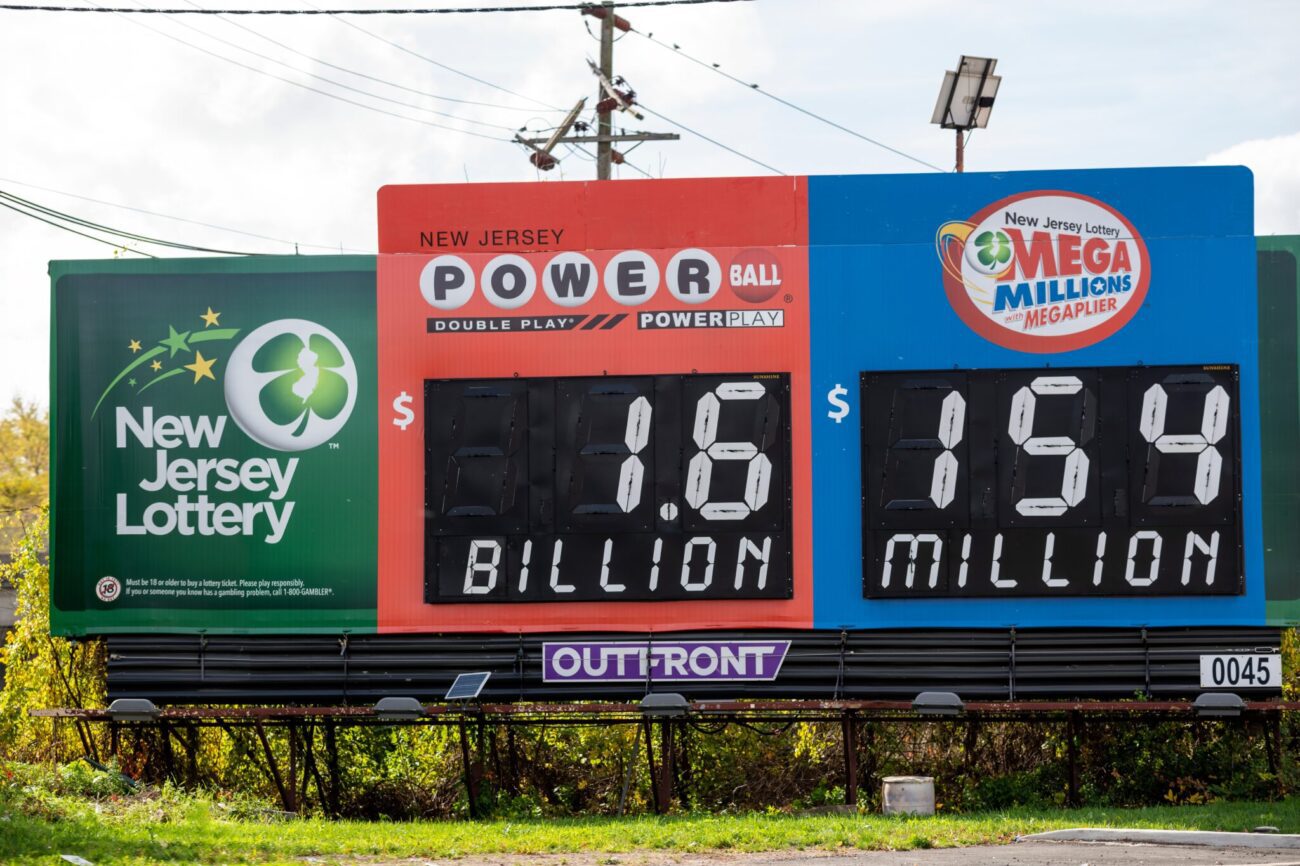
Amidst the nationwide frenzy, New Jersey has emerged as a focal point for high-tier secondary prizes. Recent terminal data confirms that a lucky participant secured a $200,000 prize by matching four white balls plus the Powerball, while leveraging the optional Power Play multiplier—which quadrupled a baseline $50,000 win due to a 4x multiplier drawn that evening.
Simultaneously, two separate players across the Garden State locked in standard $50,000 prizes by correctly matching four white balls and the red Powerball without the multiplier feature. These localized windfalls underscore the mathematical reality of lottery participation: while the grand prize commands headlines, the vast majority of economic value retained by regular players manifests in these secondary tiers.
From a capital allocation perspective, purchasing lottery tickets represents a negative-expected-value proposition. However, from a consumer entertainment expenditure standpoint, the injection of capital into local retail nodes—delicatessens, gas stations, and smoke shops—drives immediate foot traffic. Retailers receive a direct percentage commission on ticket sales and bonuses for selling winning tickets, creating a localized economic stimulus effect.
Verified Data & Metrics Breakdown
The following table outlines the structural parameters, recent New Jersey winning distribution, and financial metrics associated with the current $835 million Powerball cycle:
| Metric / Parameter | Current Drawing Details | Financial & Structural Context |
|---|---|---|
| Estimated Jackpot | $835 Million (Annuity Option) | Paid out in 30 graduated annual installments over 29 years. |
| Estimated Cash Value | Approx. $400 Million to $425 Million | Lump-sum distribution subject to immediate federal and state tax withholding. |
| N.J. High-Tier Winners | One $200K ticket; Two $50K tickets | The $200K ticket utilized the Power Play 4x multiplier option. |
| Overall Odds of Winning | 1 in 24.9 (Any Prize Tier) | Grand prize jackpot odds stand at 1 in 292.2 million. |
| State Revenue Allocation | ~35% to 40% of Gross Sales | Directed toward state educational institutions, pensions, and infrastructure funds. |
Industry & Market Implications: Who Wins, Who Loses
The structural ecosystem surrounding a multi-state lottery of this magnitude creates distinct economic winners and losers across public and private sectors:
- State Governments and Public Services: State treasuries emerge as primary structural beneficiaries. In New Jersey, lottery revenues represent a vital non-tax revenue stream, contributing billions over decades to educational support and institutional programs. As ticket sales spike during an $835 million run, state coffers experience a temporary influx of capital.
- Retail Partners and Small Businesses: Independent convenience store owners and franchise operators realize significant margin expansion during high-jackpot cycles. Beyond direct commission splits, high customer foot traffic generates cross-selling opportunities for higher-margin goods.
- Consumers and Household Balance Sheets: From a macroeconomic lens, lower-income households disproportionately allocate disposable income toward lottery tickets. Critics argue that state-sponsored lotteries act as an implicit, regressive tax on populations with lower financial literacy, transferring wealth from vulnerable demographics to state budgets.
- Wealth Management and Advisory Firms: When a jackpot reaches elite tiers, elite private banking, legal, and fiduciary advisory firms mobilize. Managing an instantaneous liquidity event of $400+ million requires sophisticated asset protection, tax mitigation, and estate planning strategies to preserve generational wealth.
Frequently Asked Questions (People Also Ask)
To address recurring public queries and long-tail search intent regarding the current Powerball surge, our investigative desk provides the following authoritative answers:
What are the actual odds of winning the $835 million Powerball jackpot?
The mathematical probability of matching all five white balls (numbered 1 through 69) and the red Powerball (numbered 1 through 26) is exactly 1 in 292,201,338. Despite the daunting odds, millions of players participate during high-jackpot cycles driven by the asymmetric upside of the payout relative to the nominal $2 ticket price.
How is the $200,000 New Jersey ticket calculated compared to the $50,000 tickets?
Matching four white balls and the red Powerball yields a standard base prize of $50,000. In the case of the $200,000 winner in New Jersey, the purchaser opted for the "Power Play" feature—a $1 add-on per play. On the night of the drawing, the multiplier drawn was 4x, which quadrupled the $50,000 secondary prize to $200,000.
What happens to unclaimed lottery prizes in New Jersey?
In New Jersey, winning tickets must be claimed within one year of the drawing date. If a prize goes unclaimed, the funds are legally mandated to be returned to the state’s contribution pool, primarily supporting educational institutions and state pension systems, ensuring that unclaimed capital remains within the public sector.
Should winners choose the cash lump sum or the annual annuity?
Financial advisors generally recommend analyzing current tax brackets, investment return horizons, and behavioral discipline. While the cash option provides immediate liquidity (subject to a heavy immediate tax bite), the 30-year annuity provides guaranteed compound growth with annual payouts increasing by 5% each year, protecting winners from immediate overspending.
Future Outlook: Milestones and What Comes Next
As ticket sales accelerate in the final 48 hours leading up to the upcoming drawing, prognosticators estimate the final jackpot valuation could surpass $835 million if ticket velocity exceeds historical models. Regulatory compliance officers across participating state lotteries will continue monitoring point-of-sale integrity, ensuring transparent RNG (Random Number Generator) audits and tamper-proof machine operations.
Key milestones to watch include the final ticket sales tally released by MUSL prior to the broadcast, the geographical distribution of upcoming winning terminals, and whether a single ticket holder or a multi-state syndicate claims the grand prize. Regardless of the outcome, the current cycle reaffirms the enduring public appetite for high-stakes lotteries—solidifying its position as a cultural touchstone and a powerful fiscal engine for state governments.