
$150 Oil is No Longer a Fantasy: How the Iran Conflict Compares to History's Worst Market Shocks
NEW YORK & MUMBAI — Global financial markets have been plunged into a state of high anxiety. As military hostilities involving Iran escalate, the global energy map is being redrawn in real-time. Brent crude is rapidly marching toward $150 per barrel—a psychological and economic threshold once dismissed by mainstream analysts as an extreme, worst-case tail risk. Today, it is fast becoming a baseline market reality.
According to ongoing analysis from The Wall Street Journal, the suddenness of the geopolitical flare-up has forced institutional investors to urgently dust off their historical playbooks. Trading desks from Wall Street to Dalal Street are asking one defining question: How does this unfolding Middle East crisis compare to the historic energy shocks that previously reshaped the global economy?
The New Energy Reality: Cenovus and the Canadian Hedge
With the Strait of Hormuz—the world’s most critical oil transit chokepoint through which 20% of global petroleum passes—facing unprecedented supply threats, energy security has jumped to the top of corporate agendas. The panic has sent shockwaves through traditional supply chains, prompting a massive rotation of capital into safe-haven energy producers.
Canadian oil sands giants, such as Cenovus Energy, have suddenly found themselves in the spotlight. For years, heavy oil producers in North America operated under the shadow of pipeline bottlenecks and discount pricing. Today, with Western nations desperately seeking stable, non-Middle Eastern barrels, Cenovus and its peers represent a crucial buffer. The investment thesis has flipped: what was once viewed as a high-cost, carbon-intensive alternative is now being repriced as an indispensable, geopolitically insulated shield against Middle Eastern disruption.
However, even a surge in North American production cannot fully offset the immediate physical loss of Iranian exports or a broader regional blockade. The fear of a protracted conflict has injected a massive risk premium into energy futures, threatening to unleash a fresh wave of global inflation just as central banks were beginning to celebrate victory over the post-pandemic pricing surge.
How the 2026 Iran Shock Compares to Historical Crises
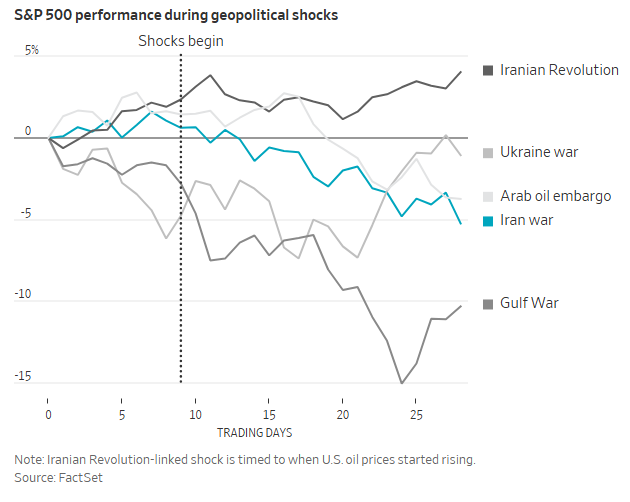
To understand where the market goes next, macro strategists are analyzing previous geopolitical flashpoints. Historically, oil shocks have acted as the ultimate accelerators of economic downturns, often forcing central banks into difficult policy trade-offs between fighting inflation and supporting growth.
The table below outlines how the current 2026 Iran crisis stacks up against the four most consequential market-shaking energy disruptions of the past fifty years:
| Event & Year | Peak Oil Price (Inflation-Adj. 2026 USD) | S&P 500 Max Drawdown | Primary Macroeconomic Consequence |
|---|---|---|---|
| OPEC Oil Embargo (1973) | ~$125 | -48% | Severe stagflation, decade-long structural inflation, global recession. |
| Iranian Revolution (1979) | ~$145 | -19% | Aggressive Fed tightening (Volcker era), deep double-dip recession. |
| Gulf War (1990) | ~$90 | -16% | Short-lived spike, mild U.S. recession followed by rapid recovery. |
| Russia-Ukraine War (2022) | ~$130 | -25% | European energy crisis, synchronized global interest rate hikes. |
| Iran War Escalation (2026) | $145 - $155 (Projected) | -12% (To Date) | Threat of renewed stagflation, disrupted maritime trade, supply-chain fractures. |
Anatomy of a Shock: What Makes This Time Different?
While the charts show clear parallels to the supply shocks of 1973 and 1979, senior market strategists warn against assuming history will repeat itself in exact detail. Today's global economy is fundamentally different in three distinct ways:
- The Shale Revolution Cushion: Unlike in 1973, the United States is now the world’s largest producer of crude oil. While domestic production cannot fully insulate U.S. consumers from global prices, it prevents the physical fuel shortages and gas-station lines that characterized the 1970s.
- The Green Transition Intersection: A sustained run at $150 oil could act as a double-edged sword. While it heavily burdens consumers in the short term, it drastically accelerates the economic viability of electric vehicles (EVs), grid-scale battery storage, and alternative energy sources, potentially pulling forward peak oil demand by several years.
- Highly Leveraged Sovereign Balance Sheets: During the 1970s, global debt-to-GDP ratios were comparatively low. Today, major economies are saddled with historic debt loads incurred during the pandemic. If central banks are forced to raise interest rates again to combat $150 oil-driven inflation, the servicing costs of this debt could trigger sovereign credit crises.
The Institutional Playbook: Winners and Losers
As risk modelers run simulations, the divergence between sectors is widening. Mega-cap technology firms, which rely heavily on consumer discretionary spending, are seeing compressed valuations as higher energy costs act as an implicit tax on consumers. Conversely, defense contractors, global shipping operations that bypass the Suez Canal in favor of longer routes, and cash-rich oil majors are experiencing massive inflows.
"We are seeing a violent rotation," noted one chief investment officer at a London-based hedge fund. "For the last two years, the market was positioned for a soft landing and falling rates. Now, we are hedging for a scenario where inflation remains sticky, and global supply chains remain weaponized. Cash and hard assets are king once again."
Frequently Asked Questions (FAQ)
1. Why is $150 oil considered such a critical tipping point for the global economy?
Historically, when the global energy bill exceeds 5% of global GDP—which typically happens when oil sustains prices above $135 to $140—it almost always triggers an economic recession. At $150 per barrel, transport, manufacturing, and agricultural costs soar, severely denting consumer purchasing power and forcing central banks to keep interest rates elevated, which chokes off economic growth.
2. Can alternative suppliers like Cenovus Energy prevent global shortages?
Producers in Canada, Brazil, and the U.S. shale patch can ramp up production, but they cannot do so overnight. Canadian oil sands, for instance, require significant capital expenditure and long lead times to expand capacity. While these regions offer invaluable geopolitical safety, they lack the immediate, unused "spare capacity" needed to instantly replace a massive, sudden disruption in the Persian Gulf.