

Executive Takeaways
- Record Cash Generation: The world's top publicly traded energy enterprises amassed historic multi-billion-dollar net incomes, driven by optimized cost structures and elevated global commodity benchmarks.
- The Consumer Burden: While upstream exploration and production segments posted unprecedented valuation multiples, median American households faced severe disposable income compression due to elevated retail gasoline and diesel prices.
- Structural Bottlenecks: Decades of underinvestment in downstream infrastructure scalability and refining capacity left domestic markets acutely vulnerable to geopolitical supply shocks.
- Shareholder Primacy vs. Capital Expenditure: Management teams heavily favored equity buybacks, special dividends, and portfolio risk mitigation over aggressive long-term production scaling.
Introduction: The Anatomy of an Economic Disconnect
In the high-stakes theater of global energy markets, a profound paradox defines the contemporary economic landscape. While executive boards in Houston, London, and Paris celebrate unprecedented cash flows and historic valuation multiples, Main Street consumers navigate a relentless erosion of purchasing power at local fueling stations. This striking divergence has ignited fierce political debates, prompted rigorous regulatory compliance scrutiny, and forced institutional investors to re-evaluate their long-term capital allocation theses.
To understand how integrated oil giants managed to post staggering cumulative net profits while retail motorists absorbed punishing pain at the pump, one must look beyond partisan rhetoric. A rigorous examination of balance sheets, refinery utilization metrics, inventory data, and macro-financial conditions reveals a complex interplay of post-pandemic demand surges, structural supply constraints, and corporate strategies laser-focused on maximizing enterprise ROI for equity holders.
The Catalytic Events: From Pandemic Crash to Super-Cycle
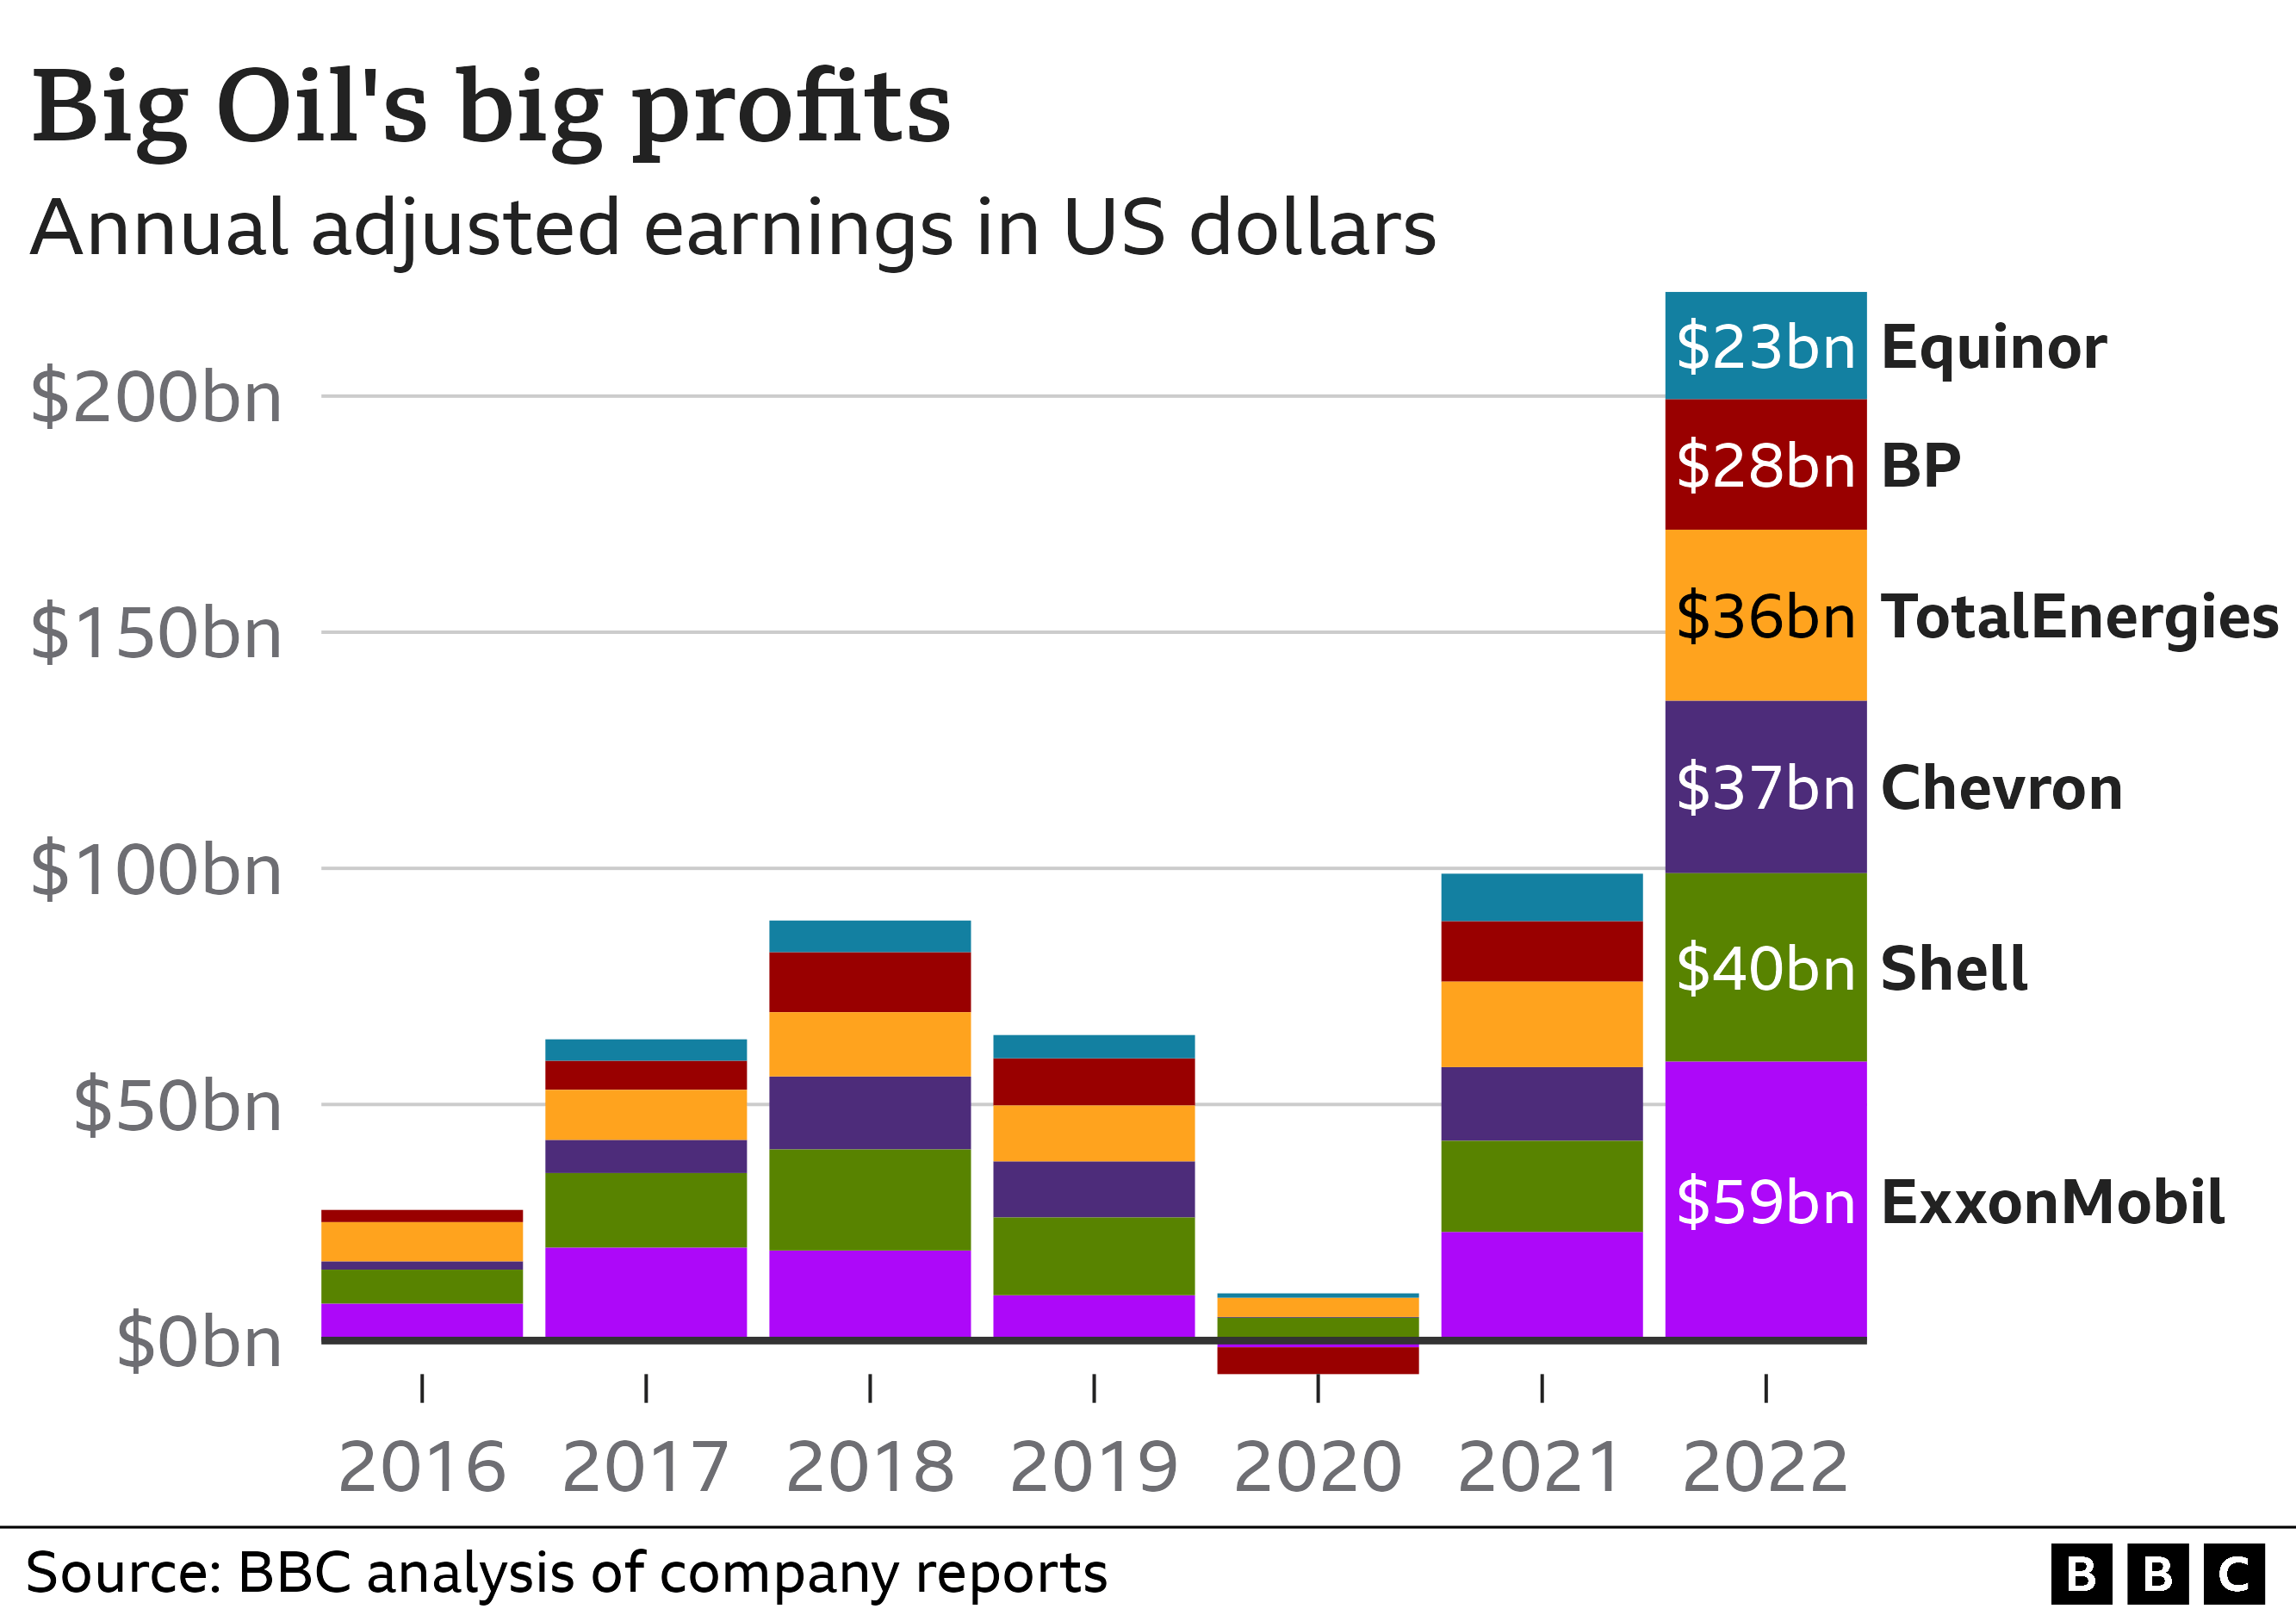
The roots of the current market structure trace back to the unprecedented demand destruction of 2020. Amid global lockdowns, West Texas Intermediate (WTI) crude futures briefly plunged into negative territory, forcing energy conglomerates to execute deep cost-cutting measures, shutter marginal extraction operations, and defer capital-intensive infrastructure projects. Thousands of petroleum engineers, geologists, and field technicians were laid off as boardrooms prioritized sheer corporate survival.
When global economic activity roared back to life in late 2021 and 2022, hydrocarbon demand rapidly outpaced the capacity of upstream producers to restart mothballed wells. Compounded by severe geopolitical conflicts—most notably the escalation of hostilities in Eastern Europe—global supply chains suffered structural fractures. Crude benchmark prices surged, creating an environment where extraction costs remained relatively flat while realized commodity prices skyrocketed. This generated an extraordinary margin expansion across the entire upstream segment.
Refining Constraints and the Retail Spread
While soaring crude prices captured headlines, the true engine behind retail consumer pain was the widening crack spread—the financial differential between a barrel of crude oil and the petroleum products refined from it, such as gasoline and diesel.
Domestic refining capacity in the United States had steadily declined in the years preceding the crisis, driven by environmental mandates, corporate consolidation, and conversions of fossil-fuel refineries into biofuel processing plants. Consequently, when post-pandemic fuel demand surged, existing refineries operated near maximum nameplate capacity. With supply inelastic in the short term, refiners commanded exceptional margins, transferring the cumulative cost pressures directly to regional distribution networks and ultimately to individual drivers.
Verified Financial Metrics & Performance Data
A comparative analysis of financial statements from major multinational energy enterprises highlights the dramatic scaling of profitability and capital distribution during the peak commodity cycle years compared to historical baselines.
| Metric Category | Pre-Pandemic Baseline (2019) | Peak Earnings Period (2022-2023) | Current Market Trajectory |
|---|---|---|---|
| Combined Net Income (Top 5 Supermajors) | ~$55 Billion | ~$150+ Billion | Normalizing / High Stabilization |
| Average US Retail Gasoline (Per Gallon) | $2.60 - $2.90 | $4.50 - $5.00+ (Peak) | $3.20 - $3.70 (Regional Variance) |
| Shareholder Distributions (Buybacks & Dividends) | ~$45 Billion | ~$110+ Billion | Continued Aggressive Return Policy |
| US Refining Utilization Rate | 89% - 93% | 94% - 96% (Effective Maximum) | 90% - 92% |
Industry & Market Implications
The financial windfall experienced by oil conglomerates has generated sweeping ripple effects across global financial markets and domestic policy circles.
Who Wins: Institutional Investors and Debt-Free Balance Sheets
Institutional asset managers, pension funds, and retail equity holders heavily exposed to the energy sector reaped massive capital gains. Rather than deploying free cash flow into risky, long-term upstream mega-projects with uncertain multi-decade demand profiles, executive management teams prioritized balance sheet fortification. Debt ratios plummeted, and excess liquidity was systematically funneled into share repurchase programs and elevated dividend yields, satisfying institutional demands for immediate, tangible financial returns.
Who Loses: Consumer Purchasing Power and Energy-Intensive Sectors
Conversely, median-income American households bore the brunt of elevated energy expenditures. Because transportation fuels represent a non-discretionary budget item for the vast majority of workers relying on personal vehicles, rising pump prices functioned effectively as a regressive tax. Secondary industries—including trucking, logistics, agriculture, and commercial aviation—faced compressed operating margins, which they subsequently passed down to consumers through higher retail goods prices, fueling broader inflationary spirals.
Frequently Asked Questions (People Also Ask)
Why do oil companies make record profits when gasoline prices rise?
Integrated oil enterprises operate across multiple segments, including upstream extraction, midstream transportation, and downstream refining. When global crude oil benchmarks rise, upstream exploration divisions generate significantly higher revenue per barrel extracted. Simultaneously, constrained global refining capacity allows companies with downstream assets to capture wider crack spreads, multiplying overall corporate profitability during high-demand cycles.
Are oil companies intentionally restricting domestic refining capacity to keep prices high?
Industry executives and independent market analysts point out that refinery cutbacks during the 2020 pandemic downturn were a direct response to catastrophic demand destruction. Rebuilding or expanding complex refining infrastructure requires capital investments spanning billions of dollars and multiple years. Given long-term global decarbonization targets and regulatory transitions toward electric vehicles, energy firms have shown reluctance to commit capital to new fossil-fuel refining assets, preferring instead to optimize existing utilization rates.
How do federal policies and taxes influence the price at the pump?
Federal and state excise taxes remain a fixed component of retail gasoline prices, alongside crude commodity costs, refining margins, and distribution fees. While federal fuel taxes have remained unchanged for decades, state-level levies vary widely. Furthermore, regulatory compliance costs, environmental blending mandates (such as renewable identification numbers), and federal leasing policies for public lands influence long-term capital expenditure decisions made by exploration and production firms.
Where does the excess cash generated by oil giants ultimately go?
In recent fiscal cycles, a vast majority of excess free cash flow has been allocated toward strengthening balance sheets, retiring corporate debt, executing aggressive share buyback programs, and distributing special dividends to shareholders. A smaller, yet growing, percentage is being directed toward lower-carbon initiatives, carbon capture technology, and renewable energy infrastructure to satisfy ESG (Environmental, Social, and Governance) investor mandates.
Future Outlook & Key Milestones to Watch
Looking ahead, the tension between corporate profitability and consumer affordability is unlikely to dissipate entirely. As global energy demand continues to interact with geopolitical friction points, industry stakeholders must navigate a delicate balancing act.
Key operational and macroeconomic milestones to monitor over the next 12 to 24 months include:
- Global Refining Capacity Additions: Tracking upcoming international refining projects in the Middle East and Asia that could alleviate structural product shortages and narrow crack spreads.
- Capital Expenditure Shifts: Analyzing quarterly earnings reports for signs of accelerated spending on traditional hydrocarbon extraction versus diversified low-carbon technologies.
- Regulatory and Legislative Actions: Monitoring potential proposals concerning windfall profit taxes, federal leasing restrictions, and stricter environmental compliance mandates in Washington and Brussels.
- EV Adoption Velocity: Evaluating the pace of electric vehicle fleet penetration and its eventual dampening effect on long-term domestic gasoline demand projections.
Reporting by the Financial, Energy, and Macroeconomics Investigative Desks. Wire sources utilized include Bloomberg, Reuters, and proprietary energy market analytics.