Executive Takeaways
Test Our Free AI & Tech Utilities Suite
Calculate LLM API token costs, analyze article dwell-time, or simulate tech DCA returns.
- Nikkei 225 Enters Bear Market: Japan’s flagship stock index has officially plunged over 20% from its historic July peak, dragged down by an aggressive hawkish pivot from the Bank of Japan (BoJ) and an unprecedented surge in the Japanese Yen.
- Nasdaq Composite Technical Correction: The tech-heavy Nasdaq locked in a technical correction—down more than 10% from its record high—driven by growing skepticism around artificial intelligence enterprise ROI, margin compression in mega-cap tech earnings, and softening U.S. macroeconomic indicators.
- Violent Carry-Trade Unwind: Multi-trillion-dollar cross-border "yen carry trades"—where institutional investors borrowed cheap yen to purchase high-yielding U.S. technology assets—are rapidly unwinding, triggering widespread prime brokerage margin calls and systematic deleveraging.
- Mixed Futures Action & VIX Spike: U.S. equity futures fluctuated wildly in early pre-market trading, while the CBOE Volatility Index (VIX) experienced one of its sharpest multi-session surges in modern market history, forcing asset managers into emergency portfolio rebalancing.
1. The Macro Flashpoint: Anatomy of a Global Liquidity Shock
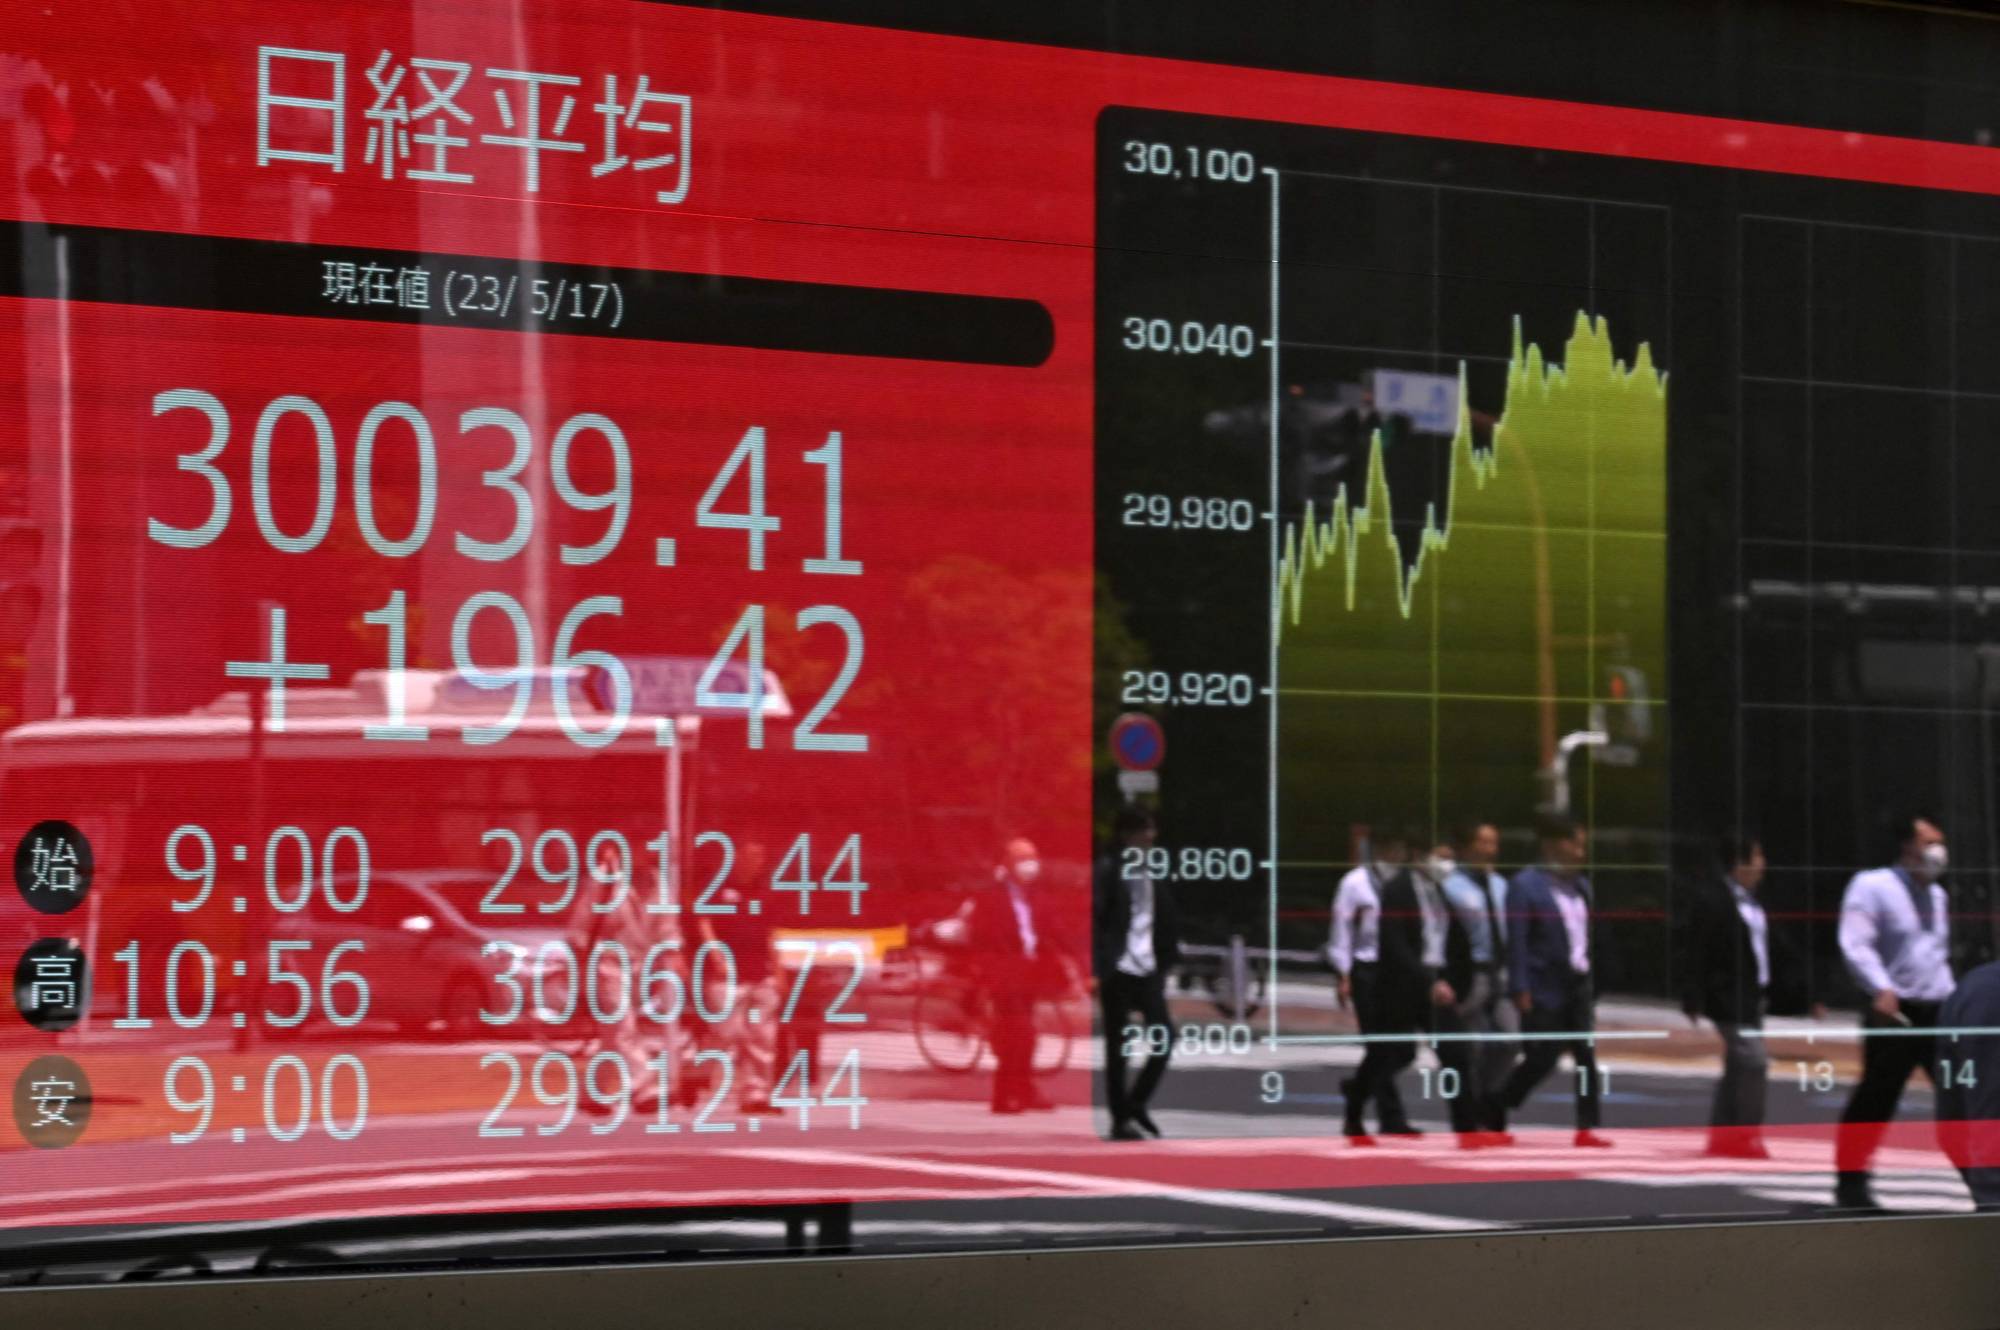
In a dramatic convergence of monetary policy divergence and valuation recalibration, global financial markets are undergoing their most severe liquidations since the regional banking crisis of early 2023. The catalyst is dual-pronged: an unprecedented structural shift in Japanese central banking coupled with a foundational reset in Wall Street’s mega-cap technology narrative.
For months, global asset allocation models relied on two foundational premises: that the Federal Reserve would execute a soft landing while keeping interest rates elevated enough to incentivize dollar strength, and that the Bank of Japan would maintain its ultra-accommodative monetary posture indefinitely. Both assumptions dissolved within a 72-hour window.
The Bank of Japan’s decision to raise its key policy rate to approximately 0.25%—accompanied by explicit signals of further quantitative tightening—sent shockwaves through international capital markets. Simultaneously, U.S. macroeconomic data signaled unexpected softening, highlighted by weak Institute for Supply Management (ISM) manufacturing numbers and an unemployment rate increase that triggered the historical recessionary diagnostic known as the Sahm Rule. The resulting panic drove equity futures into erratic, mixed territory as institutional desk traders scrambled to price in accelerated rate cuts from the Federal Open Market Committee (FOMC).
2. The Yen Carry Trade Unwind: The Hidden Engine of Cross-Asset Liquidation
To understand the depth of the Nikkei 225’s descent into a technical bear market—defined as a 20% decline from peak valuations—one must analyze the mechanics of the foreign exchange carry trade. For over a decade, zero and negative interest rates in Tokyo created a persistent regime where hedge funds, sovereign wealth managers, and algorithmic macro funds borrowed capital in yen at negligible cost, converting those funds into U.S. dollars, Euros, and high-beta risk assets.
This structural trade inflated valuation multiples across global equities, particularly in U.S. mega-cap technology, private equity credit markets, and high-yield corporate debt. However, as the yield differential between the U.S. 10-Year Treasury and the Japanese Government Bond (JGB) began to compress rapidly, the U.S. Dollar/Japanese Yen (USD/JPY) cross rate collapsed from above 161.00 down toward the mid-140s within weeks.
As the yen appreciated, the cost of servicing yen-denominated liabilities ballooned overnight. Institutional investors faced escalating margin calls from prime brokerages, forcing mandatory portfolio liquidations. Foreign investors, who had poured billions into Japanese blue-chip exporters like Toyota, Tokyo Electron, and SoftBank on the premise of a perpetually weak currency, initiated a synchronized exit. The result was a historic, multi-session rout across the Tokyo Stock Exchange, spilling directly into European and American pre-market hours.
3. Mega-Cap Tech Realignment: The Nasdaq Correction and the AI Monetization Gap
While Tokyo absorbed the blunt force of monetary unwind, New York equity desks dealt with a fundamental crisis of confidence in the technology sector. The Nasdaq Composite’s drop into technical correction territory (a sustained 10% pullback from recent record highs) marks a sharp transition from multiple expansion to fundamental execution scrutiny.
Over the past six quarters, enterprise enterprise software and hardware giants—collectively driving the S&P 500's concentration metrics to 40-year highs—benefited from massive capital expenditures poured into cloud compute architecture, data center expansion, and advanced graphics processing units (GPUs). However, recent quarterly earnings reports from hyperscalers revealed a troubling narrative: while capital expenditure budgets continue to expand by double-digit percentages, near-term revenue realization from enterprise AI implementations remains modest.
Institutional equity analysts have begun demanding clear paths to enterprise ROI. As megacaps commit hundreds of billions in ongoing capital allocation toward next-generation infrastructure, margins are coming under margin compression. The structural pivot from hyper-growth optimism to rigorous balance-sheet auditing pushed momentum funds to trim long exposure in semiconductor capital equipment suppliers and hyper-scaler cloud providers, compounding the sell-off triggered by the currency unwinding.
4. Market Data & Asset Class Performance Breakdown
The table below summarizes the extreme shifts across major asset classes, benchmark indices, and foreign exchange rates during this volatile market regime:
| Metric / Benchmark Index | Pre-Correction Peak | Current Level / Range | Total Drawdown / Shift | Primary Driving Factor |
|---|---|---|---|---|
| Nikkei 225 (Japan) | 42,224.02 pts | 31,450.00–33,000.00 pts | -21.5% to -25.0% (Bear Market) | BoJ rate hike, rapid Yen appreciation, margin calls. |
| Nasdaq Composite (U.S.) | 18,647.45 pts | 16,400.00–16,750.00 pts | -10.2% to -12.0% (Correction) | AI capex ROI delay, valuation multiple compression. |
| USD/JPY Foreign Exchange | 161.95 JPY per USD | 141.50–145.00 JPY per USD | -10.5% (Yen Surge) | Compressing US-Japan sovereign yield differentials. |
| CBOE Volatility Index (VIX) | 12.50 (Low Volatility) | 38.00–65.00 (Extreme Panic) | +200% to +400% Surge | Systematic risk parity deleveraging, option hedging. |
| U.S. 10-Year Treasury Yield | 4.70% (2024 High) | 3.68%–3.85% | -85 to -100 bps drop | Flight to quality, pricing in aggressive FOMC cuts. |
5. Industry & Market Implications: Winners, Losers, and Systemic Risk
The global recalibration of asset prices creates sharp divergence across equity sectors, asset classes, and balance-sheet risk profiles.
Industry & Corporate Losers
- Highly Leveraged Enterprise Software & Tech Startups: High-valuation tech firms lacking near-term free cash flow face severe multiple compression as venture capital liquidity contracts and cost of capital expectations remain volatile.
- Japanese Blue-Chip Exporters: Automotive and industrial behemoths reliant on a weak yen face earnings downgrades as their overseas revenues convert back into a strengthening home currency at less favorable exchange rates.
- Systematic Momentum & Trend-Following Hedge Funds: Quant strategies heavily positioned in long-tech/short-yen trades experienced catastrophic drawdowns, forcing forced liquidations to meet prime brokerage risk metrics.
Industry & Corporate Winners
- High-Quality Defensive Capital Allocation: Consumer staples, healthcare, and utility providers with strong balance sheets and consistent dividend yields are attracting defensive capital rotation away from high-beta technology.
- Short-Duration Sovereign Debt: Fixed-income portfolios heavily allocated to U.S. Treasuries and investment-grade sovereign bonds have experienced substantial price appreciation as yields dropped sharply across the curve.
- Cash-Rich Enterprise Hyperscalers: Tech firms sitting on net-cash balances exceeding tens of billions of dollars retain significant flexibility to execute accretive share buybacks at compressed valuation multiples.
6. Frequently Asked Questions (People Also Ask)
What caused Japan's Nikkei 225 to enter an official bear market?
The Nikkei 225 entered a bear market—defined as a decline of 20% or more from recent all-time highs—primarily due to a sharp pivot in monetary policy by the Bank of Japan (BoJ), which raised interest rates after decades of ultra-loose policy. This caused the Japanese Yen to rapidly appreciate against the U.S. dollar, unwinding international carry trades, damaging the earnings outlook for Japanese export giants, and forcing mass liquidations by foreign institutional investors.
How does the "Yen Carry Trade" unwind impact U.S. technology stocks and Nasdaq futures?
For years, global institutional investors borrowed funds in Japanese Yen at near-zero interest rates to buy higher-yielding global risk assets, including mega-cap U.S. technology equities. As the yen strengthened and interest rate differentials narrowed, these trades became unprofitable. Investors were forced to sell their U.S. tech holdings to pay off their yen-denominated debts, triggering heavy selling pressure on the Nasdaq and extreme volatility in stock futures.
What is the technical difference between a stock market correction and a bear market?
A stock market correction occurs when a major index, such as the Nasdaq Composite or S&P 500, declines between 10% and 19.9% from its peak. It represents a routine recalibration of valuations within an ongoing broader trend. A bear market is confirmed when an index drops by 20% or more from its peak over a sustained period, reflecting deeper structural challenges, shifting macroeconomic fundamentals, or systemic deleveraging.
How are institutional asset managers adjusting their portfolios amid this volatility?
Institutional asset managers are actively reducing long exposure to high-beta, mega-cap technology and shifting capital toward defensive sectors (utilities, healthcare, staples) and short-duration fixed income. Additionally, risk parity and systematic funds are de-risking by raising cash allocations, acquiring put option downside protection, and reducing gross leverage to comply with internal risk-adjusted capital framework mandates.
7. Future Outlook: Critical Milestones for Institutional Investors
As market participants work through this period of cross-asset volatility, institutional desks are tracking several key macro catalysts to assess whether a sustainable floor can be established:
First, all eyes turn to the Federal Reserve’s upcoming policy meetings and inter-meeting communications. Futures markets have rapidly priced in emergency or accelerated monetary easing. Should the Fed lower rates aggressively without confirming a broader economic recession, risk assets may stabilize quickly as global liquidity conditions loosen.
Second, the Bank of Japan's post-hike guidance remains vital. If Governor Kazuo Ueda signals a temporary pause in rate hikes to allow financial markets to digest recent currency fluctuations, the panic selling in Tokyo equity markets could subside, stemming cross-border contagion.
Finally, enterprise capital expenditure reports from major tech companies over the upcoming quarter will be scrutinized under a microscope. Asset managers are no longer rewarding companies solely for spending on AI infrastructure; they demand proof of margin retention, operational efficiency, and tangible enterprise software monetization. Until corporate earnings definitively bridge the gap between capital spending and bottom-line revenue, high-valuation tech indices will likely remain vulnerable to heightened intraday volatility.