Executive Takeaways
- Historic Drawdown: Wall Street’s most heavily owned consensus equities have experienced a cumulative valuation compression unseen since the aftermath of the sovereign debt crisis and 2010 flash crash era.
- Macro Catalyst Shift: High-yield liquidity drainage, elevated terminal interest rate expectations, and strict regulatory compliance mandates have forced institutional desks into aggressive risk mitigation.
- Valuation Multiples Reset: Enterprise ROI expectations and infrastructure scalability metrics are under unprecedented scrutiny, ending an era of speculative premium pricing for mega-cap growth.
- Capital Reallocation: Smart money is aggressively rotating out of overcrowded long positions, shifting capital allocation strategies toward defensive asset classes, fixed income, and resilient cash-flow generators.
For more than a decade, institutional portfolio managers, quantitative hedge funds, and retail momentum traders shared a singular playbook: overweight Wall Street’s consensus favorites, ride the unstoppable wave of mega-cap expansion, and lean heavily into high-beta growth. That playbook has just hit a brick wall. Market data released this week confirms that Wall Street’s favored equities are enduring their worst relative performance slump since 2010, shattering assumptions about market resilience and forcing a painful reckoning across trading desks from Lower Manhattan to Mayfair.
The sudden deterioration in market breadth is not merely a routine quarterly correction. It represents a fundamental structural regime change. As central banks maintain higher-for-longer monetary policies, market liquidity is drying up, exposing the vulnerability of crowded trades. In this investigative report, we dissect the macroeconomic catalysts, institutional positioning shifts, and valuation metrics driving the worst slump in a generation—and evaluate what this means for enterprise ROI and global capital allocation.
Anatomy of a Slump: The 2010 Parallels and Structural Catalysts
Test Our Free AI & Tech Utilities Suite
Calculate LLM API token costs, analyze article dwell-time, or simulate tech DCA returns.
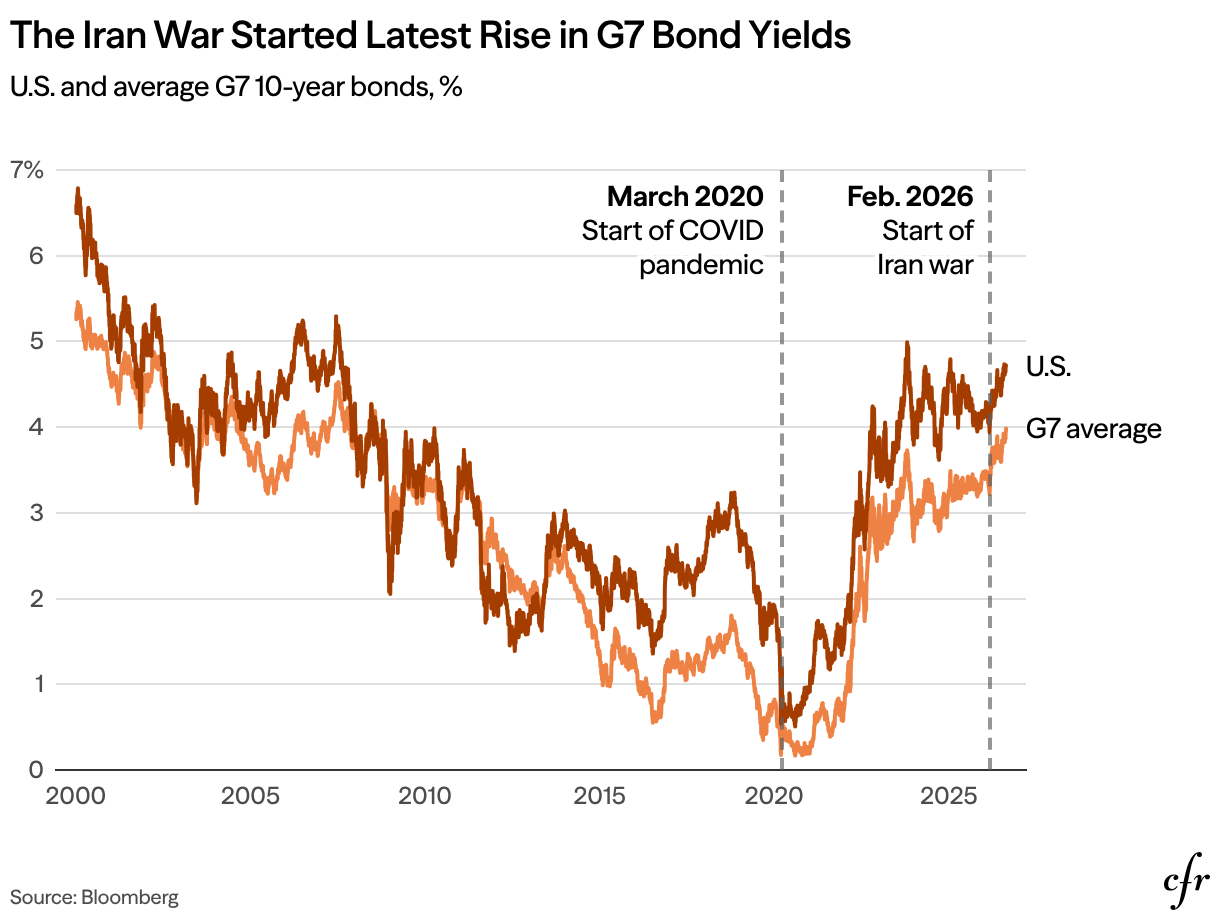
To understand the severity of the current market dislocation, one must look back to the post-financial crisis environment of 2010. Back then, the global financial system was gingerly recovering from systemic cardiac arrest, plagued by European sovereign debt contagion and lingering doubts over the stability of the banking sector. Today, the crisis is born of a different pedigree: the violent transition from an era of zero-interest-rate policy (ZIRP) to an austere regime of quantitative tightening.
For years, Wall Street’s favorite stocks—predominantly concentrated in high-growth technology, cloud compute architecture providers, and semiconductor giants—benefited from artificially suppressed discount rates. These low rates inflated future cash flow projections, allowing companies to trade at forward price-to-earnings (P/E) multiples well above historical averages. However, as the Federal Reserve and global central banks lifted benchmark rates to combat persistent inflation, the mathematics of valuation changed overnight.
Institutional investors managing multi-billion-dollar portfolios have found themselves caught in a vicious liquidity trap. Margin debt has contracted sharply, and prime brokers report a significant increase in deleveraging among hedge funds. When the most widely held stocks begin to break below key technical moving averages, algorithmic execution models and systematic risk-parity funds trigger automatic stop-loss orders. The result is a cascading downward spiral, accelerating the sell-off far beyond what underlying fundamental earnings reports would otherwise justify.
The Metrics of Distress: Valuation, Liquidity, and Risk Mitigation
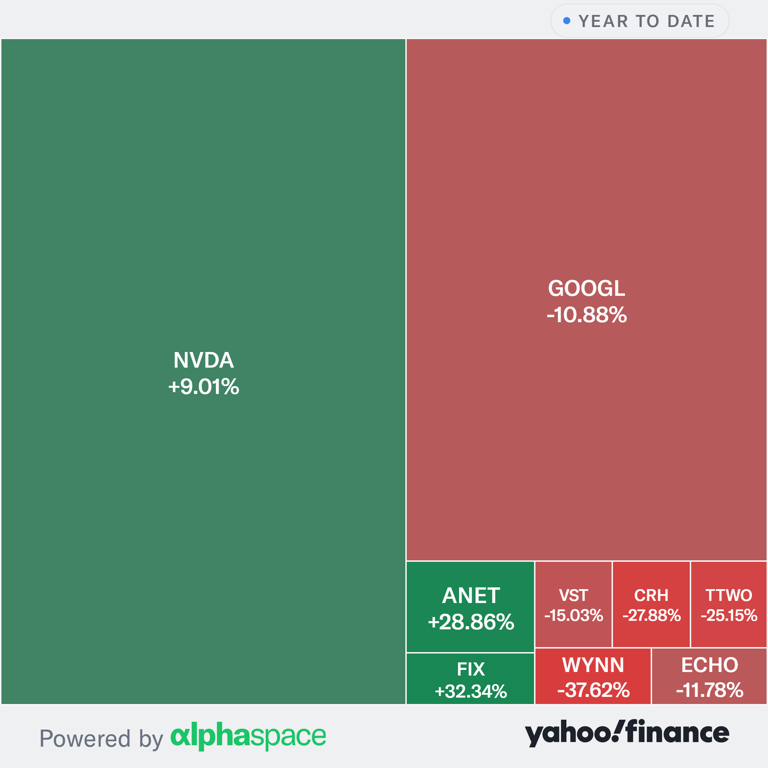
The magnitude of the current drawdown is starkly visible when examining fundamental financial indicators. For the past several years, corporate narratives centered heavily on aggressive top-line expansion, user acquisition velocity, and sweeping total addressable market (TAM) claims. Today, institutional capital allocators demand concrete proof of operational efficiency, structural profitability, and tangible enterprise ROI.
| Metric Category | 2021 Peak Era | Current Slump (2023-2024) | Historical Mean (2010-2019) |
|---|---|---|---|
| Average Forward P/E Multiple | 38.4x | 19.2x | 16.8x |
| Market Concentration (Top 10 Stocks) | 32.1% of S&P 500 | 34.8% (Peak) / Rapidly Decompressing | 21.5% |
| Prime Broker Leverage Ratios | Aggressive (2.8x net) | Defensive (1.4x net) | 1.9x |
| Average Days-to-Liquidate Position | 0.8 Days | 3.4 Days | 1.5 Days |
As illustrated in the data breakdown above, market concentration reached historic highs before the current correction took hold. When a handful of mega-cap equities dictate the directional movement of major indices, any sudden shifts in investor sentiment create outsized systemic shockwaves. Furthermore, liquidity constraints—measured by the days-to-liquidate metric—have deteriorated significantly, meaning that institutional block trades are encountering severe execution friction in public secondary markets.
Industry & Market Implications: Winners, Losers, and Capital Rotation
Every major market dislocation redistributes wealth, and the current slump is no exception. The primary losers in this environment are momentum-driven asset managers, aggressive venture-backed growth funds, and retail investors who entered the market near cyclical peaks. Companies that relied heavily on continuous debt issuance and cheap secondary equity offerings to fund operational burn rates are facing severe solvency and refinancing pressures.
Conversely, winners are emerging in unexpected corners of the global economy:
- Fixed Income & Private Credit: With risk-free yields hovering near 5%, institutional capital allocation has shifted massively toward sovereign bonds, investment-grade corporate credit, and private credit vehicles offering senior secured loans.
- Defensive Value & Cash Generators: Conglomerates, healthcare giants, and consumer staples featuring robust balance sheets and reliable dividend payout histories are capturing safe-haven inflows.
- Strict Infrastructure Scalability Leaders: Enterprises that demonstrate immediate, cost-effective scalability without reliance on external capital injections are retaining investor confidence, even as overall sector valuations contract.
Regulatory compliance is also playing a quiet yet decisive role. Global regulators are scrutinizing systemic market concentration, forcing institutional fiduciaries to diversify their holdings and adhere strictly to internal risk limits. This regulatory overlay prevents large funds from simply "buying the dip" with the same unbridled leverage utilized during previous bull runs.
Frequently Asked Questions (People Also Ask)
Why are Wall Street’s favorite stocks experiencing such a severe slump now?
The current slump is driven by a combination of high interest rates, quantitative tightening, and a massive valuation reset. For years, low interest rates inflated the prices of high-growth equities. As central banks maintain elevated borrowing costs, investors are demanding immediate enterprise ROI and stricter risk mitigation, causing a rapid unwinding of overcrowded trades.
How does the current market downturn compare to the crisis in 2010?
While the 2010 slump was rooted in post-financial crisis recovery anxiety, sovereign debt fears, and structural banking reforms, today's drawdown stems from the rapid transition away from cheap monetary policy. However, both periods share a common denominator: severe liquidity compression and sudden institutional deleveraging.
What sectors are benefiting most from this capital rotation?
Institutional capital is rotating away from high-beta growth equities and moving into fixed income, short-duration Treasury bills, private credit, and defensive value sectors such as healthcare, utilities, and consumer staples with strong balance sheets and consistent cash flows.
Are retail investors at risk during this institutional deleveraging phase?
Retail investors holding concentrated positions in high-momentum growth stocks face heightened volatility. Because institutional block liquidations increase execution friction and widen bid-ask spreads, retail participants trading on margin or short-term options are particularly vulnerable to rapid capital erosion.
Future Outlook: Key Milestones and What to Watch Next
As Wall Street navigates this treacherous transition, market participants must monitor several critical forward-looking indicators to gauge when the bleeding might stop. First, watch central bank balance sheet contraction metrics and terminal rate guidance. A premature pivot by policymakers could inject fresh liquidity, though central bankers remain wary of reigniting inflationary pressures.
Second, track prime broker leverage reports and hedge fund net exposure data. A stabilization in leverage ratios will signal that the forced unwinding of crowded long positions has run its course. Finally, corporate earnings calls will remain the ultimate litmus test. Companies that successfully demonstrate resilient profit margins, disciplined capital allocation, and genuine enterprise ROI will lead the eventual market recovery.
For executive leadership teams, the mandate is clear: the era of speculative, cash-burning growth at all costs is over. Survival and outperformance in this new regime require operational discipline, pristine balance sheets, and an unwavering commitment to sustainable, cash-generative business models.