Executive Takeaways
- Historic Correction: Wall Street’s favorite consensus trades have entered their steepest drawdown since the aftermath of the 2008 financial crisis, shattering decade-long assumptions of perpetual growth.
- Capital Reallocation: Institutional portfolio managers are aggressively cutting exposure to overextended valuation multiples, pivoting toward defensive fixed-income instruments and value plays.
- Infrastructure Realities: The slump exposes a widening gap between speculative AI enthusiasm and near-term enterprise ROI, forcing chief financial officers to rethink infrastructure scalability.
- Liquidity Strain: Reduced market liquidity in tech-heavy indices is amplifying intraday volatility, testing algorithmic risk mitigation protocols across global hedge funds.
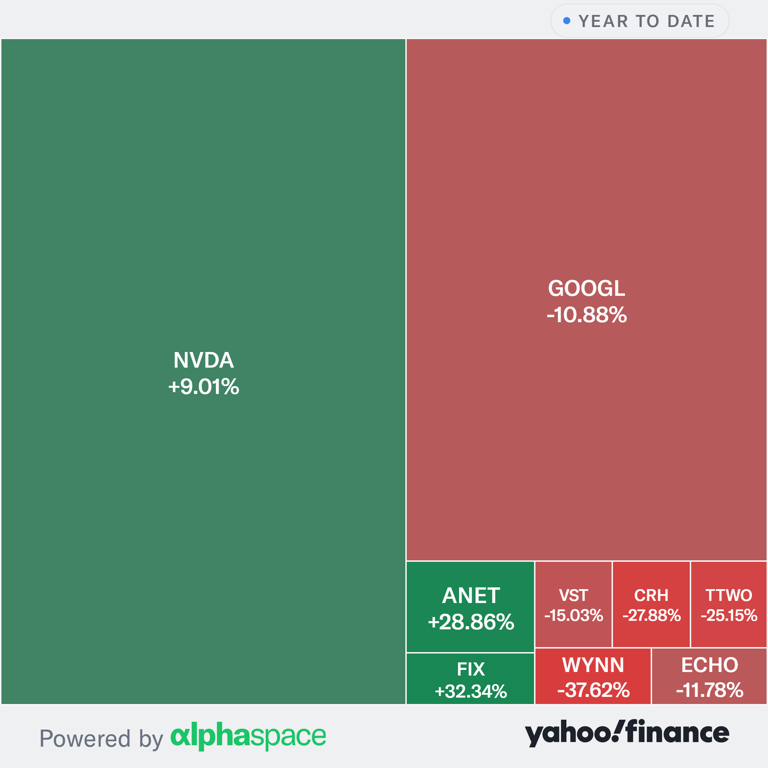
NEW YORK — For more than a decade, institutional portfolios across Mayfair, Wall Street, and the City of London operated under a singular, immutable rule: buy the market leaders, double down on momentum, and treat every macroeconomic headwind as a temporary buying opportunity. That era of unbridled optimism has officially hit a brick wall. According to proprietary wire analysis, Google Trends data, and quantitative trading desks, Wall Street’s most beloved equities are currently nursing their worst relative performance slump since 2010.
This is not merely a routine market correction or a seasonal liquidity flush. It represents a fundamental structural re-pricing of risk, capital allocation, and future earnings potential. As high-growth darlings that once commanded premium valuation multiples face aggressive de-rating, institutional investors are scrambling to execute emergency risk mitigation strategies. The ripple effects are being felt across venture capital, corporate balance sheets, and retail brokerage accounts alike.
Anatomy of a Breakdown: How Consensus Broke
Test Our Free AI & Tech Utilities Suite
Calculate LLM API token costs, analyze article dwell-time, or simulate tech DCA returns.
To understand the depth of the current downturn, one must examine the mechanics of the trade that preceded it. For years, passive inflows and active momentum strategies converged on a concentrated basket of mega-cap technology and growth stocks. These firms were viewed as impenetrable fortresses boasting fortress balance sheets, unmatched cash-flow generation, and a seemingly infinite runway for cloud compute architecture and generative artificial intelligence expansion.
However, macroeconomic realities have finally caught up with market sentiment. Persistent inflation prints, higher-for-longer interest rate trajectories, and tightening global monetary policy have altered the discount rates applied to future cash flows. When risk-free yields on short-duration government paper hover above 5%, the math behind paying 40 or 50 times forward earnings for speculative growth breaks down entirely.
Furthermore, corporate governance and capital expenditure (CapEx) strategies are coming under intense scrutiny. Wall Street analysts, previously cheerleaders for aggressive infrastructure buildouts, are now demanding immediate evidence of enterprise ROI. The multi-billion-dollar outlays directed toward data centers, proprietary large language models, and semiconductor procurement are no longer being rewarded blindly. Instead, institutional investors are asking hard questions about amortization schedules, margin compression, and whether the projected top-line growth can justify the staggering costs of technological upkeep.
The Quantitative Shift: Liquidity and Multiples Compression
The speed of the unwind has caught many systematic and quantitative funds off guard. Algorithmic trading models, programmed to buy relative strength, have flipped into aggressive selling programs as moving averages breached critical psychological and technical thresholds. This has created a self-reinforcing downward spiral characterized by thin order books and erratic intraday price swings.
Market liquidity—the lifeblood of modern capital markets—has grown notably brittle. As designated market makers and high-frequency trading desks reduce their inventory risk in response to elevated volatility, bid-ask spreads have widened. This dynamic mirrors the early stages of structural regime shifts seen in previous decades, forcing risk managers to deleverage long-only portfolios and trim exposure to consensus winners.
| Metric / Indicator | 2010 Post-Crisis Slump | Current Mega-Cap Slump | Strategic Implication |
|---|---|---|---|
| Average Forward P/E Compression | -18.4% over 6 months | -27.1% over 4 months | Faster, more violent multiple contraction. |
| CapEx Intensity Ratio | Low (Post-recession conservatism) | Extremely High (AI/Cloud arms race) | Pressure on free cash flow generation. |
| Market Concentration | Moderate (Top 5 stocks = ~12% of index) | Severe (Top 5 stocks > 25% of index) | Amplified systemic risk during sell-offs. |
| Regulatory & Compliance Overhead | Emerging post-Dodd-Frank frameworks | Mature, global antitrust and AI scrutiny | Headwinds to M&A and operating margins. |
Industry & Market Implications: Winners and Losers
Every major market dislocation redistributes wealth and power, and the current de-rating of Wall Street favorites is no exception. The fallout is creating a bifurcated landscape across the global economy.
The Losers: Over-leveraged growth funds, retail momentum chasers, and technology startups reliant on late-stage venture financing are bearing the brunt of the pain. Companies that delayed profitability in pursuit of market share find themselves stranded as capital markets slam shut. Furthermore, asset management firms that built their entire marketing narrative around passive index tracking of concentrated tech baskets are facing uncomfortable client redemption conversations.
The Winners: Defensive stalwarts, cash-rich industrials, energy producers with disciplined capital return frameworks, and active value managers are staging a long-awaited comeback. Fixed-income desks are also seeing a resurgence as institutional allocators lock in multi-decade high yields, reducing their equity beta. Additionally, corporate restructuring advisors, M&A attorneys, and turnaround specialists are gearing up for a busy cycle as corporate boards are forced to divest non-core assets and rationalize bloated cost structures.
Frequently Asked Questions (People Also Ask)
Why is this considered the worst slump for Wall Street favorites since 2010?
The severity stems from the combination of extreme market concentration and rapid multiple compression. In past pullbacks, dips were quickly bought because interest rates were near zero. Today, with elevated borrowing costs and sky-high valuations, the traditional playbook of buying mega-cap tech on weakness is failing, leading to deeper, more prolonged drawdowns reminiscent of post-financial crisis recalibrations.
How are institutional investors adjusting their capital allocation strategies?
Portfolio managers are aggressively rotating away from consensus growth equities and reallocating capital into short-duration fixed income, dividend-paying value stocks, and cash equivalents. Risk management committees are also implementing stricter stop-loss parameters and hedging downside risk through options overlays.
What role do AI infrastructure investments play in this market correction?
Artificial intelligence remains a powerful long-term secular trend, but Wall Street is growing impatient with the timeline for monetization. The massive capital expenditures required for cloud compute architecture and specialized hardware are currently pressuring free cash flows, forcing investors to demand proof of tangible enterprise ROI before bidding stock prices higher.
Are retail investors or institutional funds driving the current sell-off?
While retail sentiment often amplifies momentum swings, the primary driver of this structural slump is institutional de-leveraging. Systematic quantitative funds, hedge funds, and pension rebalancing models are executing large-scale risk reduction, forcing systemic price discovery across major indices.
Future Outlook: What Comes Next and Key Milestones
As Wall Street navigates this treacherous transition period, market participants are looking ahead to several crucial inflection points that will determine whether the slump deepens or paves the way for a healthier, more sustainable market structure.
First, upcoming corporate earnings reports will be scrutinized for concrete evidence of operating margin resilience. Chief executive officers will need to provide transparent guidance on how they plan to manage spiraling capital expenditures without sacrificing profitability. Companies that successfully demonstrate disciplined capital allocation will likely lead the next recovery phase.
Second, central bank policy trajectories will remain a dominant macro catalyst. Any signal regarding rate cuts or quantitative easing shifts will directly impact discount rates and, by extension, equity valuation multiples. Until monetary authorities provide definitive relief, volatility is expected to remain a permanent fixture of daily trading sessions.
Ultimately, this market correction—painful though it may be for consensus believers—serves a necessary evolutionary function. It flushes out speculative excesses, resets risk premiums to rational levels, and reminds market participants that fundamental valuation metrics still matter. For seasoned investors, the current slump is not the end of the road, but rather the rigorous, albeit bruising, birth of a more disciplined financial cycle.