Executive Takeaways
Test Our Free AI & Tech Utilities Suite
Calculate LLM API token costs, analyze article dwell-time, or simulate tech DCA returns.
- The Surface Rate Deception: Pioneering empirical research published on August 18, 2026, by Federal Reserve Bank of Atlanta Senior Economist Nikolay Gospodinov reveals that traditional overnight policy rates (such as the nominal Federal Funds target) are increasingly decoupled from actual financial conditions driving the real economy.
- A Precision Stance Metric: The Atlanta Fed’s newly constructed Monetary Policy Index isolates pure monetary policy signals from market noise, demonstrating how shadow liquidity, private credit expansion, and long-end yield dynamics can cause implicit monetary easing even while headline policy rates remain restrictive.
- Capital Allocation Implication: Enterprise treasury desks and institutional asset managers relying solely on central bank dot plots face heightened tail risk; structural wedges between official policy stances and broad financial conditions are mispricing corporate cost of capital, private credit spreads, and asset valuation multiples.
- Refinancing Cliff Risk: As corporate debt capital markets confront a $1.8 trillion refinancing wall through late 2027, the Gospodinov index highlights that real-world borrowing costs are diverging significantly across capital structures, favoring cash-rich tech platforms over debt-dependent middle-market enterprises.
1. The Deceptive Surface of Rate Policy: Why the Fed Funds Rate No Longer Tells the Whole Story
For decades, institutional market participants, sovereign treasury desks, and corporate Chief Financial Officers operated under a foundational macroeconomic assumption: when a central bank raises or lowers its target benchmark rate, broad financial conditions adjust in tandem across the yield curve. That transmission model has broken down.
On August 18, 2026, the Federal Reserve Bank of Atlanta published landmark research via its Policy Hub: Macroblog. Authored by financial econometrician Nikolay Gospodinov, the study introduces a sophisticated Monetary Policy Index designed to solve a fundamental problem in modern central banking—measuring the true stance of monetary policy when broad financial conditions diverge sharply from official policy rates.
In the post-pandemic macro regime, financial markets have witnessed unprecedented volatility in term premia, private credit market expansion, and rapid shifts in bank capital regulation. While official central bank communications often emphasize headline policy rates, real-economy borrowing conditions—expressed through corporate credit spreads, commercial paper yields, equity cost of capital, and mortgage rates—frequently run counter to central bank intent. The Atlanta Fed research proves that evaluating monetary policy through nominal overnight rates alone creates a dangerous policy illusion, masking systemic liquidity buildup or unexpected economic tightness.
2. Deconstructing the Gospodinov Index: Anatomy of the Transmission Wedge
The core innovation of Gospodinov’s research lies in its econometric isolation of monetary policy shocks from macro-financial feedback loops. Standard Financial Conditions Indices (FCIs)—such as those published by Goldman Sachs or the Federal Reserve Bank of Chicago—often mix endogenous market responses (such as stock market rallies driven by corporate earnings surprises) with pure monetary policy signals. This creates endogeneity bias, making it difficult for policymakers and risk officers to determine whether easing conditions stem from central bank actions or broader economic momentum.
To overcome this, the Atlanta Fed’s model constructs a clean monetary policy stance index by filtering high-frequency asset price movements around official Federal Open Market Committee (FOMC) announcements, short-term rate expectations, and term premium adjustments. The resulting index is then mapped directly against broad measures of market liquidity and financial stress.
The empirical findings reveal several striking structural dynamics:
- The Private Credit Shadow Cushion: The rapid growth of non-bank financial intermediation and private credit funds (which reached $2.1 trillion globally by mid-2026) has attenuated standard monetary tightening. Even when central bank rates sit in restrictive territory, private debt funds absorb yield-seeking capital, keeping liquidity accessible for upper-middle-market corporations and dampening policy transmission.
- Term Premium Volatility: Fiscal deficits and record sovereign bond issuances have unanchored long-term real yields from the short-term policy rate. Consequently, long-term borrowing costs can spike independently of central bank rate pauses, creating localized credit crunches in capital-intensive sectors.
- International Cross-Border Spillovers: As highlighted in parallel comparative studies from the Banco de España and the Bank for International Settlements (BIS), cross-border capital flows frequently counteract domestic policy stances. Foreign capital inflows seeking high US risk-adjusted returns effectively dilute domestic central bank tightening measures.
3. Historical Comparison & Econometric Metrics Breakdown
To understand the practical application of the Atlanta Fed’s Monetary Policy Index, institutional investors must analyze how real financial conditions have deviated from headline policy benchmarks across key macroeconomic regimes over the past six years. The table below illustrates the divergence between official target rates, broad financial conditions, and corporate cost of capital metrics.
| Macroeconomic Policy Epoch | Nominal Fed Funds Rate (%) | Atlanta Fed Policy Stance Index | Broad FCI Indicator (Goldman/Chicago Standard) | US Investment-Grade Credit Spread (bps) | Enterprise Average WACC (%) |
|---|---|---|---|---|---|
| 2021 Zero-Lower-Bound Era | 0.00% – 0.25% | -2.45 (Ultra-Accommodative) | 97.8 (Extremely Loose) | 88 bps | 4.2% |
| 2022–2023 Rapid Tightening Phase | 5.25% – 5.50% | +2.80 (Highly Restrictive) | 101.4 (Tightening) | 165 bps | 8.9% |
| 2024–2025 Rebalancing Cycle | 4.50% – 4.75% | +0.95 (Moderately Restrictive) | 99.1 (Neutral/Eased) | 115 bps | 6.8% |
| Late 2026 Modern Divergence Epoch | 3.75% – 4.00% | +1.42 (Restrictive Shadow Stance) | 98.4 (Deceptively Loose) | 98 bps | 7.4% |
The quantitative data demonstrates a critical distortion in the late-2026 market environment: despite official policy rate cuts bringing the headline Fed Funds target down to the 3.75%–4.00% corridor, the Atlanta Fed’s Monetary Policy Stance Index sits at +1.42��indicating that underlying monetary policy remains significantly more restrictive than equity markets suggest. High real interest rates, elevated corporate Weighted Average Cost of Capital (WACC), and tight bank liquidity coverage standards under Basel III enforcement continue to exert persistent drag on enterprise balance sheets.
4. Industry & Market Implications: Capital Allocation in a Divergent Regime
The structural wedge between central bank interest rate targets and real-world financial conditions creates distinct competitive winners and losers across corporate finance, real estate, and technology infrastructure.
Enterprise Winners
- Mega-Cap Technology Platforms: Scale technology leaders with massive fortress balance sheets and organic cash flow generation are insulated from elevated enterprise WACC. These firms leverage high real interest rates to yield substantial investment income on cash reserves while aggressively funding mission-critical enterprise AI deployment and high-ROI cloud compute architecture.
- Private Credit and Special Situations Funds: Asset managers specializing in direct lending, private debt, and structured equity solutions benefit from ongoing bank disintermediation. As traditional commercial banks restrict lending to maintain regulatory capital compliance, private lenders capture premium risk-adjusted returns with senior secured terms.
- Large-Cap Financial Institutions with Core Deposit Franchises: Top-tier global systemically important banks (G-SIBs) retain strong net interest margins by lagging deposit beta adjustments while deploying capital into high-yielding short-duration paper and corporate loan facilities.
Enterprise Losers
- Highly Leveraged Middle-Market Enterprises: Businesses operating with high debt-to-EBITDA ratios and floating-rate debt structures face severe interest coverage pressures. The Gospodinov index demonstrates that despite nominal rate relief, real corporate credit conditions for non-investment-grade issuers remain tight, accelerating debt restructuring activity.
- Commercial Real Estate (CRE) Development: Property developers and real estate investment trusts (REITs) holding maturing debt facilities encounter severe valuation resets. Cap rate expansion driven by elevated real yields continues to challenge refinancing options for office and retail assets.
- Capital-Intensive Infrastructure & Legacy Manufacturing: Projects requiring multi-year capital deployment cycles before generating free cash flow face depressed net present value (NPV) calculations under higher discount rates, forcing deferred capital expenditure.
5. Frequently Asked Questions (People Also Ask)
What is the difference between a central bank monetary policy stance and market financial conditions?
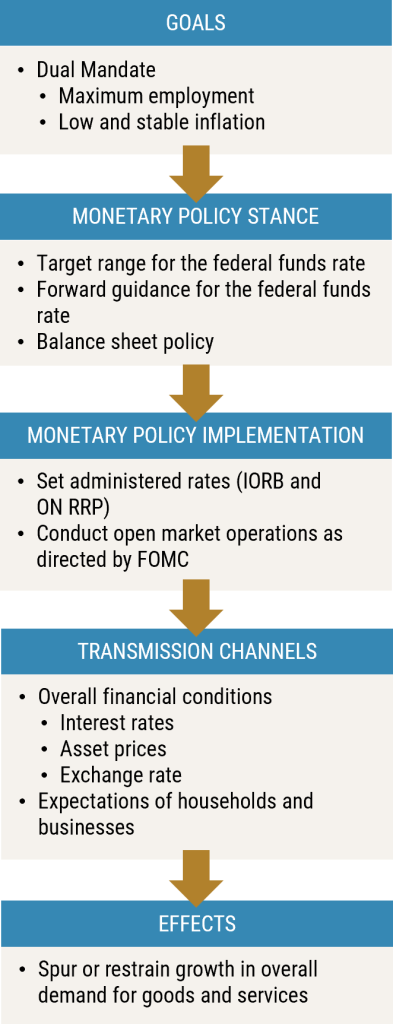
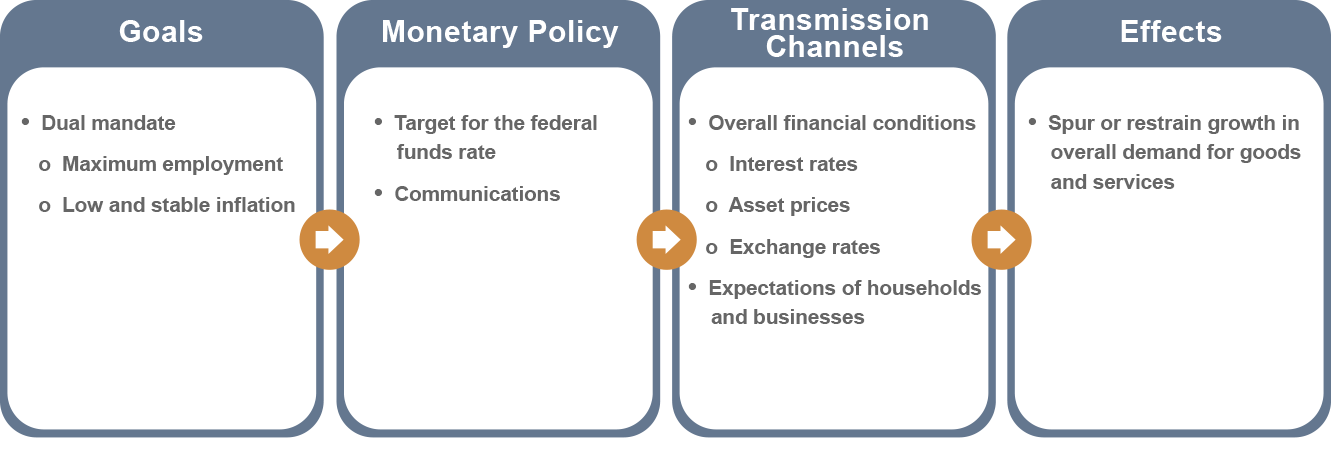
The monetary policy stance reflects the intentional policy stance established by a central bank through short-term benchmark rates, forward guidance, and balance sheet operations (quantitative easing or tightening). Financial conditions represent the broader economic environment formed by financial market prices, including corporate credit spreads, equity valuations, exchange rates, term premia, and bank lending standards. While central banks set the policy stance, financial conditions determine the actual transmission of liquidity into the broader real economy.
How does the Atlanta Fed's new monetary policy index improve traditional market tracking?
Traditional Financial Conditions Indices (FCIs) aggregate macro asset price movements, but often suffer from endogeneity bias by mixing market-driven economic optimism (such as stock market rallies) with pure policy effects. The Atlanta Fed index, constructed by Nikolay Gospodinov, uses econometric decomposition to filter out market noise, isolating the exact impulse generated by central bank policy. This provides risk managers and policymakers with an objective metric of whether central bank policy is actively easing or tightening monetary conditions.
Why can financial conditions loosen even when nominal interest rates remain elevated?
Financial conditions can loosen independently of benchmark rate cuts if credit spreads narrow, equity market valuations rise, mortgage rates fall due to compressing term premia, or non-bank shadow credit fills liquidity gaps. If corporate borrowers can access funding through private debt capital markets at tighter spreads, overall market liquidity eases even if official central bank interest rates remain technically in restrictive territory.
How should enterprise CFOs adjust capital structure strategies based on policy stance indicators?
Enterprise treasurers and CFOs should avoid relying solely on central bank dot plots or nominal interest rate trajectories when planning debt refinancing or capital investment programs. Instead, corporate leaders must monitor broad policy stance indices to gauge underlying capital costs. In an environment where shadow policy tightness persists despite nominal rate cuts, treasury desks should prioritize extending debt maturity profiles, utilizing interest rate swaps, and evaluating asset sales to optimize balance sheet flexibility.
6. Future Outlook & Strategic Roadmap: Navigating 2027 Macro Volatility
As financial markets head into the final quarter of 2026 and look toward 2027, the Atlanta Fed’s Monetary Policy Index serves as a critical strategic compass for institutional capital allocation. Several structural catalysts will dictate macro liquidity over the next 12 to 18 months:
- Recalibration of the Neutral Rate ($r^*$): Central banks worldwide are coming to consensus that the structural equilibrium real rate ($r^*$) has shifted permanently higher due to fiscal spending pressures, green energy transition financing, and supply chain nearshoring. Investors should anticipate higher structural baseline discount rates over the next decade.
- The $1.8 Trillion Refinancing Maturity Wall: Between late 2026 and December 2027, a massive tranche of corporate debt issued during the low-rate era of 2020–2021 matures. Companies that failed to optimize capital structures during rate-easing windows will face significant margin compression or equity dilution as debt rolls over at structurally higher yields.
- Regulatory Capital Requirements & Bank Liquidity: Continuous implementation of final Basel III capital frameworks will maintain pressure on commercial bank risk-weighted assets (RWA). Capital-scarce commercial banks will increasingly focus regulatory capacity on high-margin corporate relationships, accelerating the migration of leveraged finance into private credit markets.
The ultimate takeaway for institutional market participants is clear: headline central bank rates are no longer a sufficient proxy for corporate liquidity. By utilizing high-precision metrics like the Atlanta Fed Monetary Policy Index, financial leaders can cut through nominal policy signals, accurately price capital risk, and position enterprise balance sheets for sustainable growth across changing economic cycles.