In an unprecedented alignment of institutional market sentiment, not a single sell-side equity strategist surveyed by Bloomberg is forecasting a decline for the S&P 500 in 2026. Twenty-one out of twenty-one prognosticators across tier-one global investment banks have planted their flags firmly in bullish territory—a rare, total capitulation of the market’s bears that simultaneously signals relentless corporate optimism and triggers structural alarm bells for seasoned contrarians.
Executive Takeaways
- Unanimous 21-for-21 Bullish Consensus: Every primary equity strategist monitored by Bloomberg forecasts positive total returns for the S&P 500 through year-end 2026, marking the first perfectly unified non-negative annual outlook since the onset of the post-pandemic cycle.
- Earnings Growth Over Multiple Expansion: The median forecast points to mid-to-high single-digit index upside, anchored on an estimated blended S&P 500 earnings per share (EPS) expansion to between $275 and $290, driven primarily by operational leverage rather than further P/E multiple inflation.
- AI Capex Maturation & Enterprise ROI: Wall Street models assume massive hyper-scaler capital expenditures ($200+ billion annualized) transition from speculative cloud compute architecture buildouts to demonstrable enterprise ROI, protecting operating margins across non-tech sectors.
- The Positioning Paradox: Historically, periods of zero-bear unanimity on Wall Street precede sharp mid-year drawdowns; extreme positioning, compressed equity risk premiums (ERP), and crowded long trades create acute vulnerability to asymmetric external shocks.
The Anatomy of a 100% Bullish Wall Street Consensus
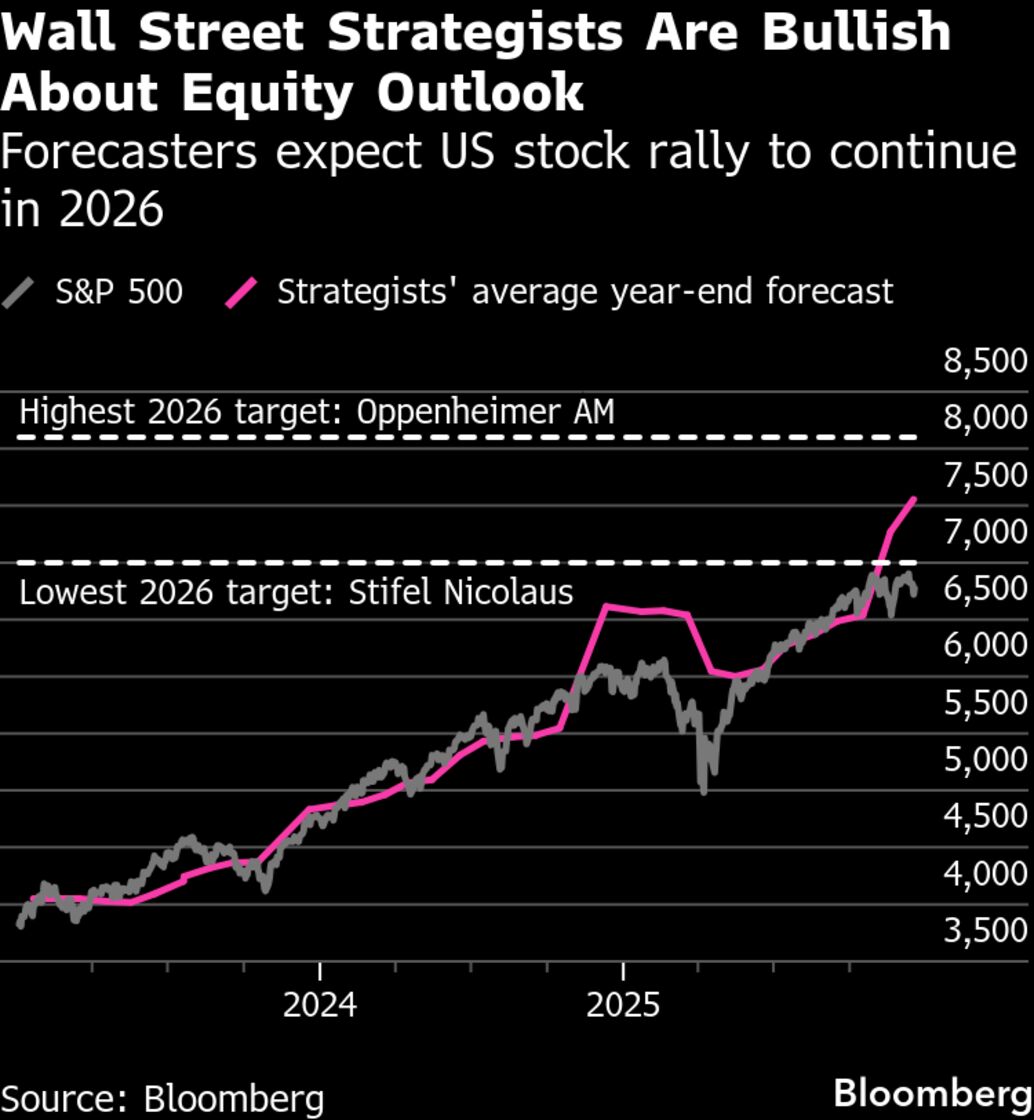
Sell-side equity research desks are notoriously resistant to consensus unanimity. Institutional business models incentivize differentiation: boutique research houses often carve out market share by forecasting contrarian drawdowns, while bulge-bracket houses balance corporate client risk management with capital markets underwriting. Yet heading into 2026, the spectrum of disagreement has collapsed. The spread among the 21 surveyed strategists is not between bulls and bears; it is strictly between conservative bulls and hyper-aggressive bulls.
The institutional rationale rests on a macroeconomic trifecta: the synchronization of global monetary easing, sustained domestic GDP resilience, and the broadening of productivity gains beyond the initial cohort of mega-cap semiconductor fabricators. Strategists at firms including Goldman Sachs, Morgan Stanley, JPMorgan Chase, Bank of America, and Deutsche Bank have laid out roadmaps indicating that the cyclical headwinds of 2022–2024—surging interest rates, balance-sheet runoffs, and margin pressures—have been fully absorbed by corporate America.
Crucially, this survey reflects a rare ideological shift: the structural "soft landing" narrative has morphed into a structural "no landing, sustained expansion" doctrine. With the Federal Reserve having lowered the benchmark policy rate into a neutral zone, sell-side desks argue that corporate debt refinancing cliffs—once deemed an existential threat for late 2025 and 2026—have been rendered manageable through robust corporate debt markets, high market liquidity, and private credit absorption.
The Engines of Growth: AI Monetization, Capital Allocation, and Enterprise ROI
Underpinning every bullish note submitted to Bloomberg is the non-negotiable requirement for earnings expansion. Having elevated valuation multiples to historically stretched percentiles (forward price-to-earnings ratios hovering above 21.5x), the equity market cannot rely on multiple expansion to engineer further gains. The entire weight of the 2026 rally rests on bottom-line corporate execution.
First-wave artificial intelligence investments focused almost exclusively on infrastructure scalability—spending hundreds of billions on specialized silicon, accelerated server clusters, high-bandwidth memory, and electrical grid infrastructure. The 2026 Wall Street thesis asserts that the second wave—software enablement and broad-market enterprise ROI—will finally materialize on corporate income statements.
Sell-side equity models assume that Fortune 500 firms outside the tech sector (industrials, financial services, healthcare, and logistics) will realize an aggregate 100 to 180 basis points of operating margin expansion by deploying automated workflows, algorithmic resource allocation, and cloud compute architecture optimizations. This efficiency dividend is projected to offset lingering wage stickiness, stabilizing corporate free cash flow conversion rates at near-record highs.
Valuation Multiples and Market Liquidity Under Scrutiny
While bottom-up equity analysts express unwavering confidence in earnings trajectories, quantitative analysts and derivatives strategists note that the margin for error has vanished. The Equity Risk Premium (ERP)—the excess return that investing in equities provides over a risk-free rate such as the 10-year U.S. Treasury note—has contracted to levels not witnessed since the mid-2000s.
With 10-year Treasury yields anchored around the 4.00% to 4.30% corridor, holding equities at 22 times forward earnings demands near-flawless macro execution. Any systemic friction—whether localized inflation flare-ups, sovereign debt supply imbalances, or margin compression from regulatory compliance mandates—could force a violent multiple re-rating without an actual deterioration in absolute earnings.
Nevertheless, strategists point to a powerful tailwind: money-market cash reserves. With more than $6 trillion parked in ultra-short cash equivalents, any gradual reduction in front-end yields creates a systemic incentive for asset managers to reallocate toward dividend-growing equities, high-yield corporate credit, and broad equity index trackers to meet institutional hurdle rates.
Verified Forecast Matrix: Sell-Side Price Targets & Key Assumptions
The following institutional survey data reflects published projections, target bands, and underlying core thesis drivers among leading Wall Street research desks heading into 2026.
| Institution / Desk | 2026 S&P 500 Target | Implied Total Return | Projected S&P 500 EPS | Primary Upside Catalyst | Identified Key Risk Factor |
|---|---|---|---|---|---|
| Goldman Sachs | 6,800 – 7,000 | +8.5% to +11.5% | $282 | Broad-market AI productivity adoption; corporate buybacks | Tariff escalations; margin compression in non-tech |
| Morgan Stanley | 6,750 | +7.8% | $280 | Cyclical re-acceleration; capital spending normalization | Sticky long-term bond yields; valuation multiple contraction |
| JPMorgan Chase | 6,600 | +5.4% | $275 | Global monetary easing synchronization; inventory rebuild | Geopolitical energy disruption; labor market loosening |
| Bank of America | 6,900 | +10.2% | $285 | Cash repatriation to equities; dividend growth resilience | Sovereign debt issuance crowding out equity liquidity |
| Deutsche Bank | 7,100 | +13.4% | $290 | Robust M&A cycle resurgence; lower real cost of capital | Commercial real estate write-downs; private credit defaults |
| UBS Global Wealth | 6,700 | +7.0% | $278 | Central bank balance sheet stabilization; consumer spending | Fiscal policy gridlock; cross-border trade friction |
The Contrarian Dilemma: The Hazard of the Crowded Boat
To market historians, 100% consensus is rarely an unalloyed blessing. Unanimity on Wall Street often acts as a contrarian indicator, not because the underlying fundamental analysis is inherently flawed, but because of market mechanics: when every institutional portfolio manager has positioned for an upside scenario, marginal buying power is exhausted.
When expectations are universally positive, the market’s pricing mechanism becomes asymmetric. Favorable earnings and pristine economic releases are already fully baked into equity valuations, producing modest positive price action. Conversely, negative earnings surprises, unexpected inflation data, or sudden geopolitical shifts run into a market that possesses zero downside hedging, leading to rapid, high-velocity liquidations.
Historically, when the Bloomberg strategist survey exhibits zero bears—such as the early-cycle positioning seen in late 2017 entering 2018, or the uniform bullishness entering 2022—the subsequent 12 months witnessed significant structural volatility. In 2018, the index suffered the "Volmageddon" breakdown in February and a near-bear market drop in December. In 2022, the absolute uniformity of early-year optimism preceded the steepest market drawdown since the global financial crisis.
Industry Winners, Losers, and Capital Reallocation Trajectories
The complete absence of sell-side bears does not mean capital will be distributed evenly. In fact, institutional forecasts signal an internal rotation away from narrow market leadership toward a broader cross-section of the economy.
The Structural Winners
- Equal-Weight S&P 500 & Mid-Caps: As valuation multiples for mega-cap tech face ceiling effects, fund managers are actively redirecting inflows into value and cyclical segments tradeable at 15x to 17x forward earnings.
- Industrial Automation & Electrical Infrastructure: The convergence of reshoring initiatives, utility-scale data center power demands, and clean energy modernization places industrial electrical suppliers and engineering firms in a multi-year secular upswing.
- Corporate & Investment Banking: With central banks lowering baseline financing costs, deferred mergers, acquisitions, and private equity sponsored exits are expected to unleash substantial underwriting, advisory, and syndication fee revenues.
The Vulnerable Segments
- Unprofitable Cloud Software (SaaS): Companies with high price-to-sales multiples that rely on continuous debt or equity dilution face sharp repricing as enterprise buyers demand immediate cost justification and AI utility rather than multi-tiered software subscriptions.
- Low-End Discretionary Consumer: Despite macro resilience, lower-income demographics continue to deplete excess savings and navigate high cumulative inflation, putting consumer-lending institutions and subprime auto lenders under sustained credit provisioning stress.
- Commercial Office Properties: The multi-year lag in leases rolling off will peak across major urban centers, forcing regional banking institutions to maintain elevated loan-loss provisions, caping upside for regional bank valuations.
Frequently Asked Questions (People Also Ask)
Has Wall Street ever been 100% bullish before, and what happened next?
Yes. While rare, unanimous or near-unanimous bullish consensus occurred in Bloomberg strategists surveys heading into 2000, 2007, and early 2018. In each of these cycles, the market encountered significant structural volatility within the subsequent 12 to 18 months. Market history demonstrates that total unanimity often coincides with peaks in positioning and sentiment, leaving the equity market acutely exposed to unexpected macroeconomic or liquidity shocks.
What S&P 500 earnings per share (EPS) are analysts modeling for 2026?
The institutional consensus among surveyed Wall Street desks models S&P 500 aggregate EPS between $275 and $290 for the 2026 calendar year. This represents an annualized year-over-year earnings growth rate of approximately 8% to 11%, driven primarily by corporate efficiency gains, share repurchases, stable operating margins, and corporate tax stability.
How will Federal Reserve rate policy impact equity valuations in 2026?
The consensus roadmap assumes the Federal Reserve holds the fed funds rate within a neutral band of 3.25% to 3.75%. This is expected to lower corporate borrowing costs for floating-rate debt and ease maturity roll-overs without signaling recessionary alarm. However, if the Fed is forced to pause or reverse cuts due to persistent services inflation, the high price-to-earnings ratios supporting the 2026 consensus could compress rapidly.
What are the primary tail risks that could derail the 2026 stock market rally?
The primary threats identified by institutional desks include: sustained fiscal deficits causing long-term Treasury yields to spike above 5.0%, tariff and protectionist trade policy implementation sparking cross-border trade disruptions, corporate failure to translate massive AI infrastructure investments into billable enterprise revenue, and geopolitical escalations disrupting key maritime trade corridors and commodity prices.
The Horizon: Critical Milestones and Strategic Triggers for 2026
As the market prepares to navigate this zero-bear landscape, institutional asset allocators will not simply buy and hold passive indices; they will monitor precise trigger points to validate or dispute the consensus narrative.
The first critical test arrives during the Q1 earnings reporting cycle, where Fortune 500 executive suites must demonstrate real-world margin expansion stemming from technological deployment. Simultaneously, fixed-income market health will serve as the arbiter of equity multiples: if the U.S. Treasury's quarterly refunding announcements trigger supply digestion issues at the long end of the yield curve, equity markets will struggle to maintain current multiples regardless of corporate profitability.
The consensus for 2026 is unambiguous: the macro storm clouds have supposedly cleared, corporate profitability is durable, and equities remain the undisputed primary asset class for global capital. Yet on Wall Street, absolute certainty is the ultimate double-edged sword. Investors riding the zero-bear wave must remember that in financial markets, when everyone is leaning to the same side of the ship, the greatest systemic risk is not what is visible on the radar, but the sudden shift of the cargo beneath.