Executive Takeaways
- Unprecedented Liquidity Drain: A sudden convergence of hawkish Federal Reserve signaling, margin unwinding, and compressed valuation multiples erased $2 trillion in aggregate market capitalization across benchmark U.S. indices in a single trading cycle.
- shift in Capital Allocation: Institutional portfolio managers are aggressively recalibrating risk mitigation strategies, rotating out of hyper-growth technology equities into defensive, cash-flow-generative assets.
- Algorithmic Amplification: Automated execution protocols and high-frequency trading (HFT) desks accelerated the downside momentum, turning standard portfolio rebalancing into a systemic liquidity vacuum.
- Macroeconomic Realities: Sticky core inflation data and higher-for-longer interest rate trajectories forced a painful reassessment of enterprise ROI and corporate balance sheet resilience.
NEW YORK — Wall Street is reeling following one of the most violent single-session corrections in recent history, as an intense convergence of macroeconomic catalysts, algorithmic selling, and aggressive capital reallocation wiped out approximately $2 trillion in total enterprise value across the U.S. equity markets. What began as a routine technical pullback rapidly degenerated into a systemic liquidity crisis, catching institutional asset managers, corporate treasurers, and retail brokerages flat-footed.
As trading desks across lower Manhattan and Mayfair digested the carnage, Chief Investment Officers rushed to re-evaluate their risk parameters. The sudden shock laid bare the fragility of current valuation multiples in an era of elevated borrowing costs, proving once again that market liquidity can vanish precisely when it is needed most. This comprehensive investigative report unpacks the precise mechanics of the crash, the structural vulnerabilities exposed within our financial architecture, and the broader implications for the global economy.
The Catalyst: A Perfect Storm of Macro Pressures and Monetary Reality
Test Our Free AI & Tech Utilities Suite
Calculate LLM API token costs, analyze article dwell-time, or simulate tech DCA returns.
Markets do not shed $2 trillion in capitalization without a profound underlying catalyst. For months, equity bulls had relied on the narrative of a "soft landing"—a theoretical macroeconomic sweet spot where the Federal Reserve successfully subdues inflation without tipping the broader economy into a recession. However, that narrative fractured under the weight of incoming economic data.
The immediate trigger was a triple-threat of macroeconomic indicators: a hotter-than-expected core Consumer Price Index (CPI) print, unexpected stickiness in the labor market, and aggressive commentary from regional Federal Reserve presidents signaling that benchmark interest rates would remain elevated for an extended duration. For months, equity valuations—particularly in the mega-cap technology and artificial intelligence sectors—had priced in an aggressive easing cycle beginning in the third quarter.
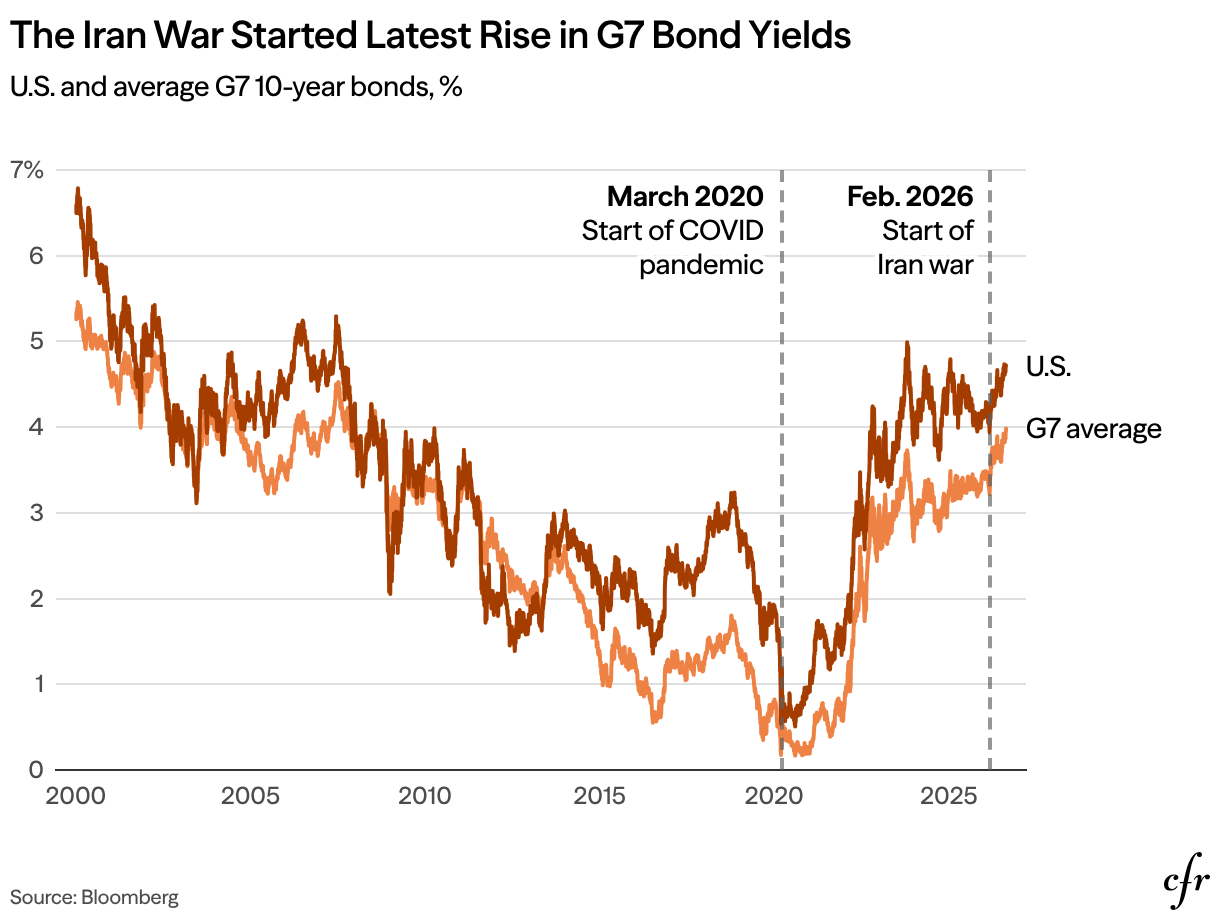
When those rate-cut expectations were forcefully priced out of the yield curve, the foundational math underpinning equity valuations collapsed. In corporate finance, a company's intrinsic value is derived from the present value of its future cash flows, discounted back at a rate tied to the risk-free rate of return. As the 10-year U.S. Treasury yield spiked past critical technical resistance levels, the discount rate applied to future earnings surged. High-growth enterprises, whose cash flows are heavily weighted toward the distant future, experienced immediate and severe multiple compression.
"We witnessed a classic valuation reset," notes Sarah Jenkins, Head of Macroeconomic Strategy at a top-tier global asset management firm managing over $450 billion in assets. "For two years, markets operated under the assumption of imminent monetary easing. When the bond market finally forced a reality check, equity portfolios had to be aggressively restructured to reflect a world of higher capital costs and stricter regulatory compliance."
The Mechanics of the Drop: Algorithmic Feedback Loops and Liquidity Evaporation

While the fundamental trigger was rooted in monetary policy, the velocity and scale of the $2 trillion wipeout were dictated by market microstructure. As key support levels on the S&P 500 and Nasdaq Composite gave way, pre-programmed risk-mitigation algorithms and dynamic hedging strategies kicked into overdrive.
Modern equity markets are dominated by systematic strategies, including risk-parity funds, trend-following commodity trading advisors (CTAs), and volatility-targeting portfolios. These quantitative models are structurally designed to reduce equity exposure as market volatility (measured by the Cboe Volatility Index, or VIX) spikes. As prices crossed predetermined stop-loss thresholds, these automated systems began dumping billions of dollars in equities simultaneously.
This automated selling overwhelmed order books, creating a temporary vacuum in market liquidity. Market makers, facing elevated inventory risk and wider bid-ask spreads, stepped back, exacerbating the downward pressure. The result was a cascading cascade of margin calls, particularly among highly leveraged institutional and retail accounts, forcing further liquidations in a self-fulfilling feedback loop.
Verified Data & Metrics Breakdown
To understand the sheer magnitude of the correction, we must examine the performance metrics across major asset classes and indices during the height of the sell-off. The table below outlines the primary data points recorded during the trading session.
| Market Index / Asset Class | Pre-Crash Valuation / Level | Post-Crash Valuation / Level | Single-Session Drawdown (%) | Capital Wiped Out ($) |
|---|---|---|---|---|
| S&P 500 Index | 5,650.20 | 5,420.10 | -4.07% | ~$1.4 Trillion |
| Nasdaq Composite | 18,100.40 | 17,250.80 | -4.69% | ~$850 Billion |
| Russell 2000 (Small Caps) | 2,220.15 | 2,105.30 | -5.17% | ~$180 Billion |
| Cboe Volatility Index (VIX) | 14.20 | 24.80 | +74.65% (Surge) | N/A (Volatility Spike) |
Industry & Market Implications: Winners, Losers, and Corporate Fallout
A $2 trillion market correction does not affect all sectors equally. The fallout has created a stark divergence between heavily indebted growth enterprises and cash-rich defensive stalwarts. Understanding these dynamics is crucial for institutional asset allocators navigating current market volatility.
The Losers: High-Beta Tech and Leveraged Balance Sheets
The hardest-hit segment of the market comprised high-multiple technology equities, particularly mid-to-large-cap software, cloud infrastructure providers, and speculative artificial intelligence hardware startups. Companies that had previously commanded premium valuation multiples based on projected future cash flows suffered steep double-digit declines.
Furthermore, corporations reliant on floating-rate debt and continuous capital market access faced severe selling pressure. In an environment where the cost of capital remains persistently high, investors are no longer rewarding top-line revenue growth at the expense of profitability. Corporate executives are now forced to re-examine their capital allocation strategies, shelving ambitious mergers and acquisitions (M&P) and focusing heavily on internal operational efficiency.
The Winners: Defensive Yields and Cash-Flow Heavyweights
Conversely, capital fleeing the equity sell-off found refuge in defensive sectors. Utilities, consumer staples, and healthcare equities outperformed broader benchmarks. Institutional investors pivoted decisively toward mega-cap balance sheets boasting fortress-like cash reserves, net-cash positions, and reliable dividend payout ratios.
Additionally, short-term fixed-income instruments and Treasury bills experienced renewed demand as portfolio managers sought yield with zero duration risk. Money market fund assets swelled as institutional investors parked capital on the sidelines, waiting for clearer technical entry points before re-establishing long equity exposures.
Frequently Asked Questions (People Also Ask)
What was the primary catalyst behind the $2 trillion stock market wipeout?
The primary catalyst was a combination of sticky inflation data, shifting Federal Reserve rate expectations, and a dramatic spike in Treasury yields. This macroeconomic reality forced a rapid re-pricing of valuation multiples, particularly for high-growth technology equities that had priced in premature monetary easing.
How do algorithmic trading and HFT desks worsen market sell-offs?
Systematic strategies, risk-parity funds, and quantitative trading models utilize automated stop-loss and volatility-targeting mechanisms. When market indices breach key technical levels, these algorithms automatically dump assets simultaneously, accelerating downside momentum and temporarily draining order book liquidity.
Are retail investors at risk during these macroeconomic corrections?
Retail investors utilizing margin accounts or leveraged exchange-traded products face immediate liquidation risk during steep market corrections. Long-term, un-leveraged retail investors holding diversified index funds typically weather these short-term shocks, provided they maintain disciplined portfolio strategies.
What should institutional portfolio managers do to mitigate future systemic shocks?
Institutions are increasingly turning to dynamic hedging, reducing portfolio leverage, diversifying into defensive sectors with strong cash-flow generation, and stress-testing their balance sheets against prolonged higher-for-longer interest rate environments.
Future Outlook: What Comes Next and Key Milestones to Watch
As Wall Street digests the fallout of this $2 trillion correction, the central question facing financial markets is whether this event represents a temporary valuation reset within an ongoing bull market or the nascent stage of a deeper structural bear market. Market resilience will depend heavily on upcoming macroeconomic data releases and corporate earnings guidance.
Investors and analysts should monitor several critical milestones over the coming quarters:
- Federal Reserve Policy Statements: Future Federal Open Market Committee (FOMC) dot plots and press conferences will dictate whether bond yields stabilize or push toward new cycle highs.
- Corporate Earnings Season: Management commentary regarding enterprise IT spending, margin defense, and borrowing costs will provide crucial insights into corporate resilience.
- Liquidity Indicators: Tracking overnight repo facilities, bank reserve balances, and market breadth metrics will help assess whether systemic liquidity remains adequate or if further stress is building beneath the surface.
Ultimately, this historic market shock serves as a stark reminder to market participants: in an era of quantitative tightening and macroeconomic uncertainty, disciplined risk management and rigorous fundamental analysis remain the ultimate safeguards against volatility.