WASHINGTON & NEW YORK — In an inflection point that will recalibrate global capital allocation for the rest of the decade, the Federal Reserve has formally drawn the curtain on its multi-year balance sheet contraction. The decision to conclude Quantitative Tightening (QT), illuminated in a seminal market liquidity analysis co-authored by CFA Steve Johnson and Jason Graveley, signals a delicate transition from monetary contraction to liquidity preservation. Behind closed doors at the Marriner S. Eccles Federal Reserve Building and across primary dealer trading desks, the calculus became undeniable: the buffer of cash parked in overnight funding facilities had eroded to operational minimums, threatening to spark the kind of money-market turbulence that paralyzed Wall Street in September 2019.
As the Fed throttles back its runoff of Treasury notes and agency mortgage-backed securities (MBS), institutional treasurers, sovereign wealth funds, and private credit conduits are moving quickly to reprice duration risk, credit spreads, and asset-liability structures. This is not merely a technical adjustment of the System Open Market Account (SOMA); it is an economic armistice that reshapes enterprise ROI calculations, enterprise debt refinancing schedules, and valuation multiples across global equities.
Executive Takeaways
- Structural Liquidity Floor Reached: The Fed terminated balance sheet runoffs after aggregate bank reserves dipped dangerously close to the estimated "Lowest Comfortable Level of Reserves" (LCLoR), while the Overnight Reverse Repo (ON RRP) facility was effectively exhausted below its friction point of $100 billion.
- Repo Market Relief: Secured Overnight Financing Rate (SOFR) spikes above the Interest on Reserve Balances (IORB) rate in mid-to-late 2025 triggered mandatory balance-sheet defense protocols, forcing the Federal Open Market Committee (FOMC) to end QT to avert an acute liquidity crisis.
- Corporate Capital Allocation Shift: With sovereign debt supply absorption shifting back toward neutral, corporate issuers face lower liquidity risk premia, dramatically reducing the structural headwinds facing multi-billion-dollar enterprise cloud infrastructure and artificial intelligence CAPEX programs.
- SOMA Reinvestment Pivot: The central bank will transition to full reinvestment of maturing paper, initially stabilizing its balance sheet before preparing for organic balance sheet expansion pegged to nominal GDP growth in late 2026.
The Anatomy of the Runoff: Why QT Reached Its Inflexible Limit
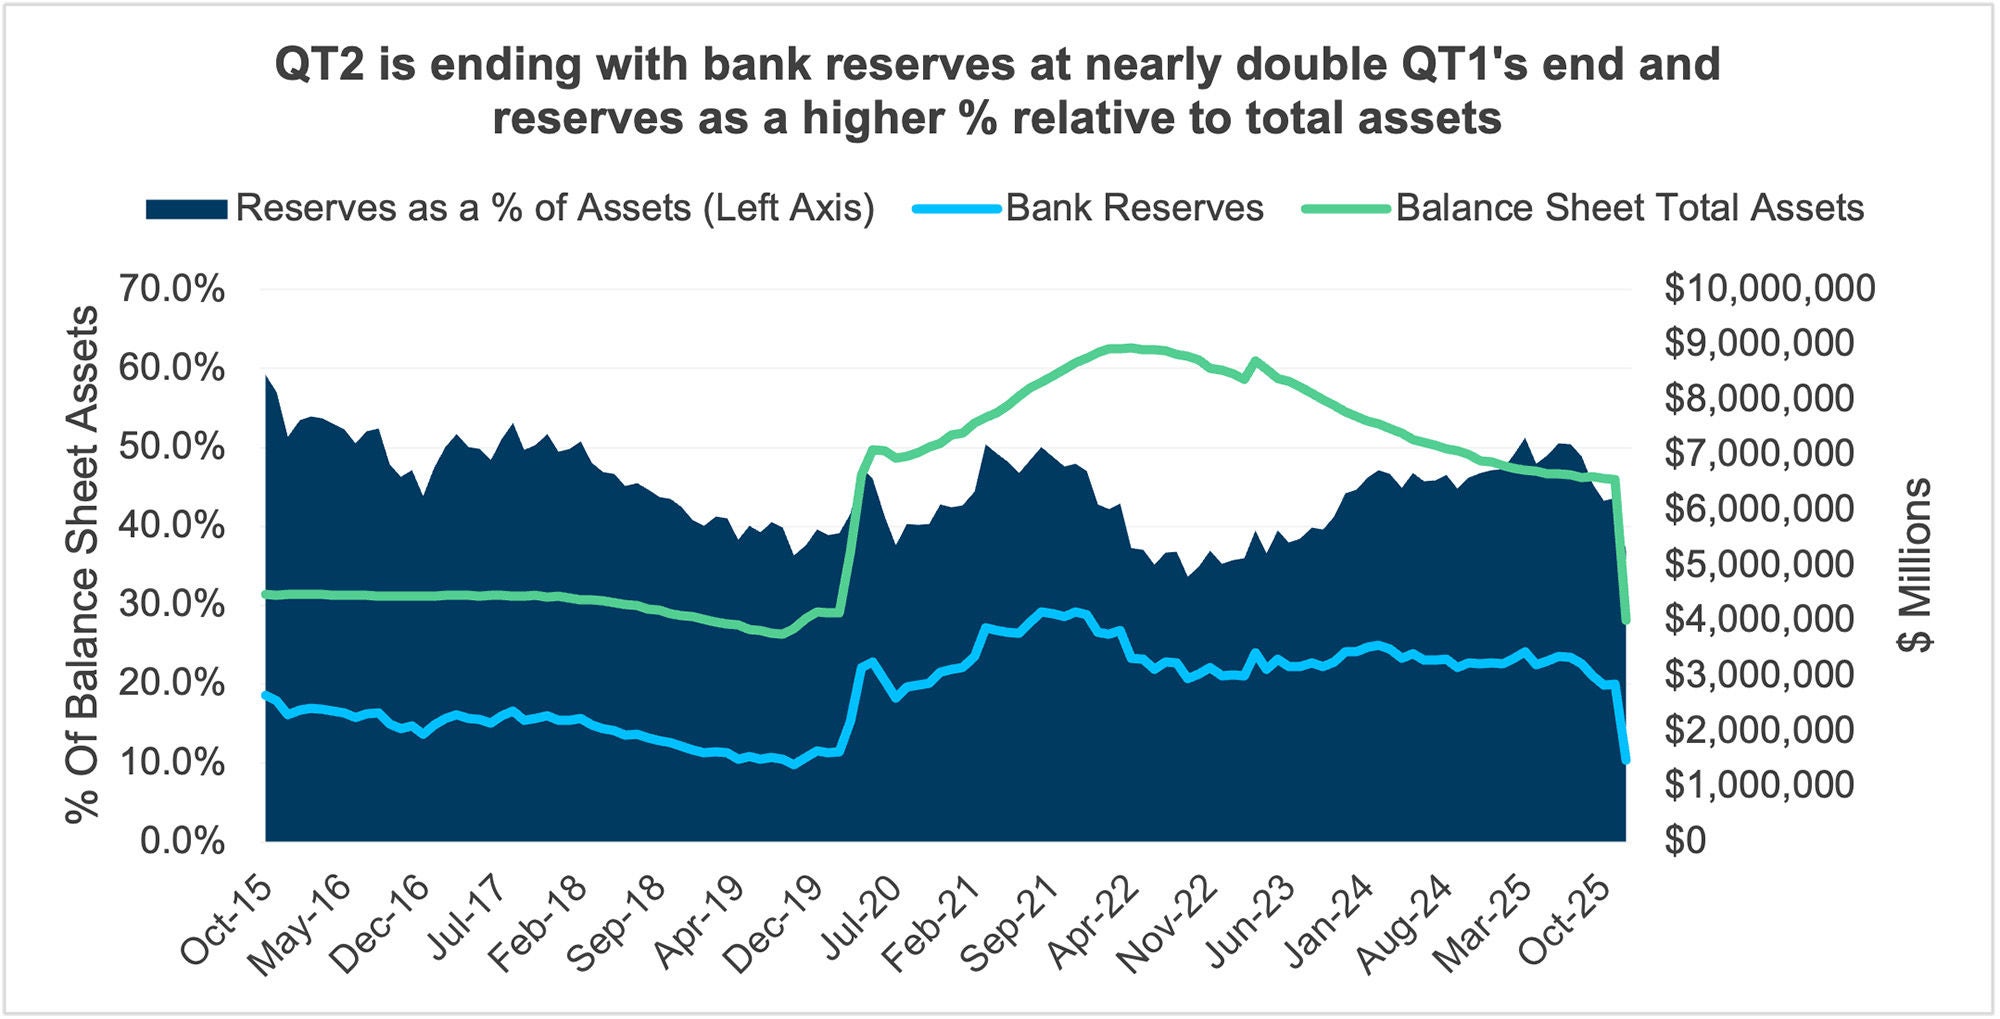
To understand the mechanics of the Fed’s capitulation, one must dissect the plumbing of the U.S. financial system. When the Fed initiated QT2 in June 2022, its balance sheet sat at an unprecedented peak of nearly $9 trillion. The central bank set monthly runoff caps that eventually reached $60 billion for Treasuries and $35 billion for agency debt. For the first two years of the program, the real-economy effects of this contraction were largely sterilized by the massive, multi-trillion-dollar liquidity cushion stored in the ON RRP facility.
Money market mutual funds, incentivized by yields on the Fed's overnight facility, withdrew capital from the central bank rather than drawing down commercial bank deposits. This allowed the Fed to shed more than $2 trillion in assets without depleting the bank reserves required for regulatory compliance under Basel III and the Dodd-Frank Act. However, by late 2024 and through 2025, that insulation vaporized. With the ON RRP depleted to near-zero levels, every marginal dollar of balance sheet shrinkage began extracting liquidity dollar-for-dollar from commercial bank reserve balances.
As reserve balances fell toward the critical $3.0 trillion threshold—roughly 10% to 11% of U.S. nominal GDP—structural frictions surfaced. Intraday payment overdrafts ticked up at custodian banks, and primary dealers began experiencing localized balance-sheet indigestion under the relentless wave of U.S. Treasury net issuance. The market’s circulatory system was running dry.
The Shadow of September 2019 and SVB
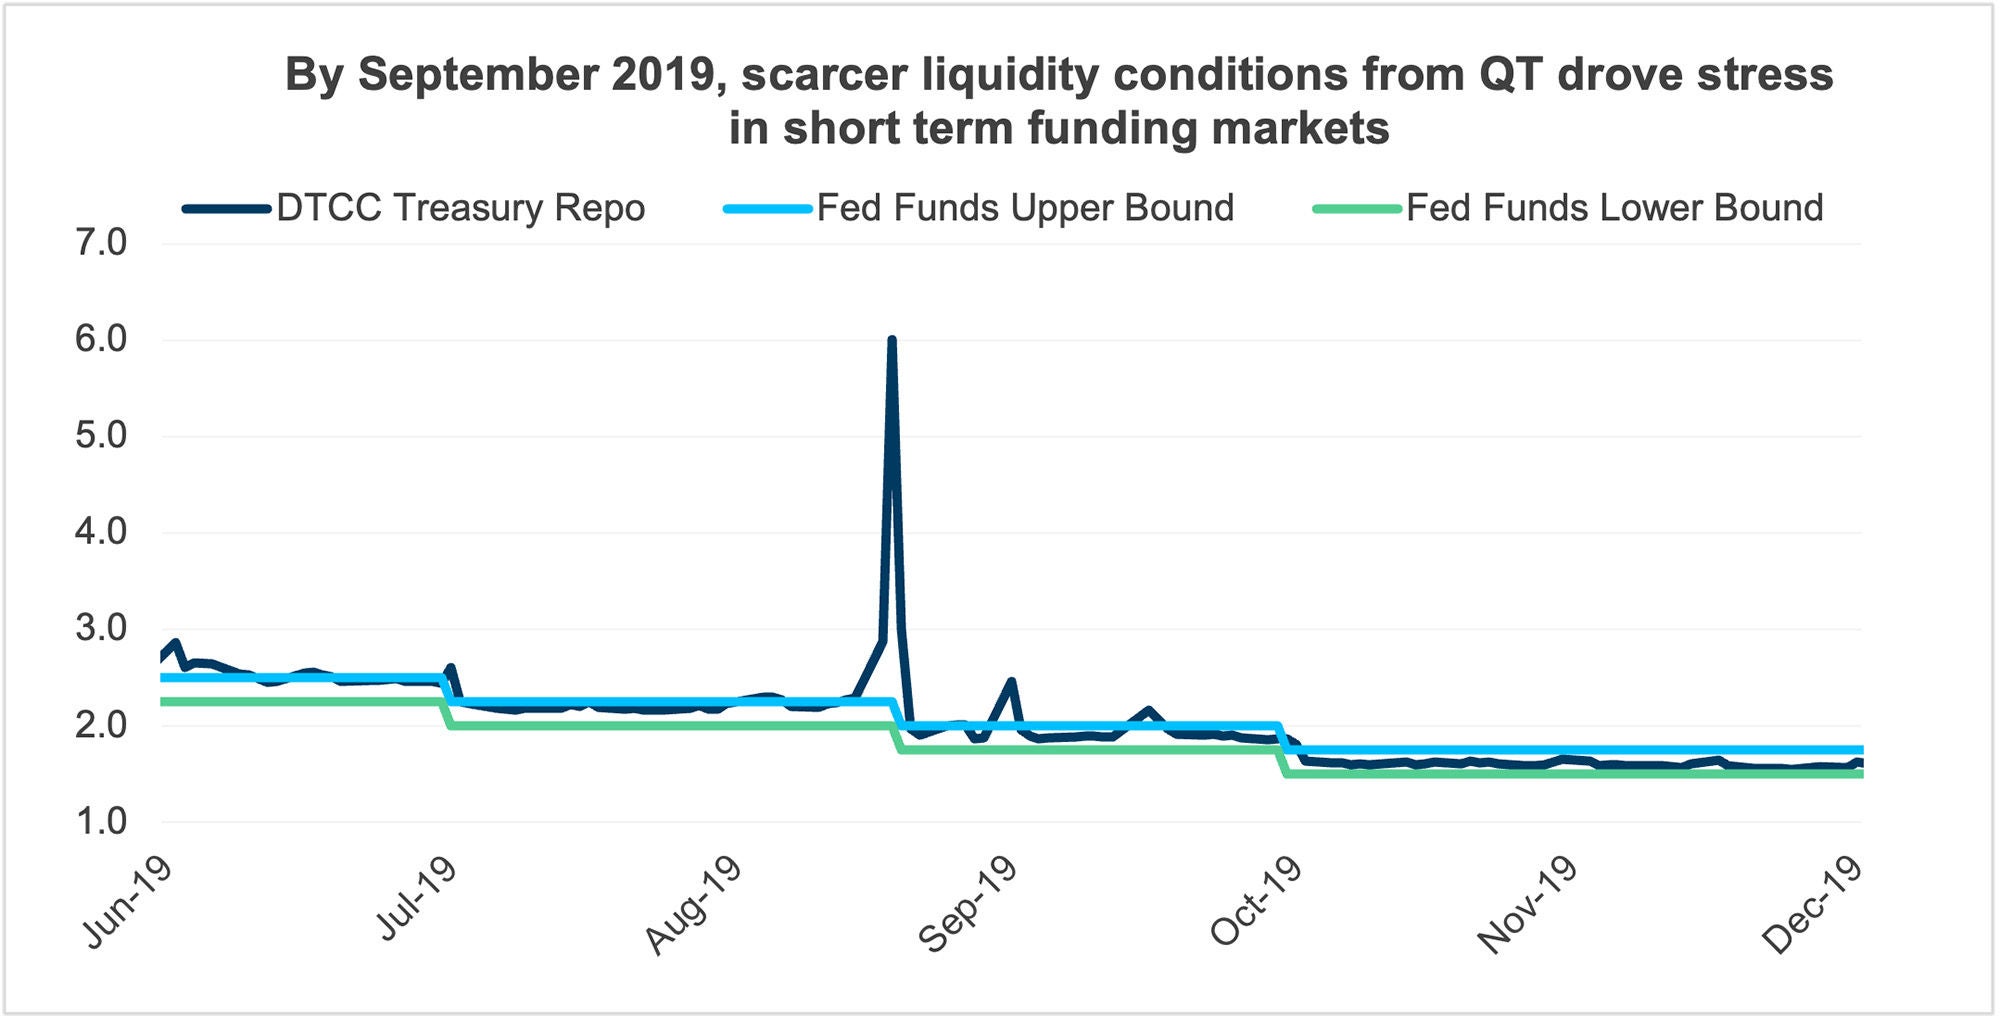
The institutional memory of the Federal Reserve is haunted by two distinct failures: the sudden repo market freeze of September 2019, when overnight rates vaulted past 10%, and the regional banking panic of March 2023, sparked by Silicon Valley Bank’s asset-liability mismatch. Analysis from Johnson and Graveley underscores that the 2025 financial ecosystem, while augmented by the Standing Repo Facility (SRF), could not withstand a continued bleed of aggregate liquidity without systemic risk.
Regional and mid-sized commercial banks, continuously balancing stringent Liquidity Coverage Ratio (LCR) mandates against yield-seeking loan books, were forced back into the Federal Home Loan Bank (FHLB) system and wholesale funding lines. Rather than wait for an intraday breakdown in the tri-party repo complex, the Fed preemptively shut down QT to safeguard financial plumbing stability.
Data Breakdown: The Lifecycle of the Fed’s SOMA Contraction
The quantitative journey of balance-sheet shrinkage reflects the scale of the Fed’s intervention and the ultimate mathematical boundaries of sovereign debt absorption.
| Metric / Indicator | Peak (Mid-2022) | Pre-Taper Pivot (Early 2024) | Terminal QT Level (Nov 2025) | Variance / Net Change |
|---|---|---|---|---|
| Total SOMA Portfolio | $8.96 Trillion | $7.50 Trillion | $6.65 Trillion | -$2.31 Trillion (-25.8%) |
| ON RRP Take-Up | $2.45 Trillion | $580 Billion | $68 Billion | -$2.38 Trillion (-97.2%) |
| Bank Reserve Balances | $3.40 Trillion | $3.55 Trillion | $3.12 Trillion | -$280 Billion (-8.2%) |
| SOFR-IORB Spread | -8 bps (Deep discount) | -2 bps (Parity) | +4 to +7 bps (Stress spikes) | +12 to +15 bps expansion |
| Treasury Absorption Burden (Non-Fed) | ~75% of net issuance | ~95% of net issuance | 100% of net issuance | Shift to structural saturation |
Macroeconomic & Market Implications: Winners, Losers, and Asset Allocation
The cessation of QT fundamentally restructures market microstructure across primary, secondary, and derivative markets. With the Fed removing its persistent selling pressure, private balance-sheet capacity is instantly liberated.
1. Capital Allocation & Enterprise Balance Sheets
For Chief Financial Officers and corporate treasurers navigating capital-intensive industries—most notably enterprises funding hyperscale cloud compute architectures and semiconductor manufacturing—the end of QT removes a severe liquidity risk premium. Throughout 2024 and 2025, corporations faced aggressive "crowding out" effects as the primary dealer community hoarded cash to digest massive sovereign debt auctions. With the Fed ceasing its asset roll-offs, debt syndicates can underwrite corporate debt with tighter spreads, providing a predictable hurdle rate for enterprise ROI calculations and strategic M&A activity.
2. The Banking Sector: Relieving the LCR Squeeze
Large money-center institutions (JPMorgan Chase, Bank of America, Citigroup) and regional lenders alike emerge as clear operational winners. Under strict regulatory compliance, banks must hold high-quality liquid assets (HQLA) against potential 30-day cash outflows. QT was relentlessly turning cash reserves (the most liquid asset) into an operational scarce good. By cementing the reserve floor above $3.1 trillion, the Fed eliminates the risk of forced portfolio rebalancing and lowers depository institutions' reliance on expensive brokered deposits.
3. Fixed Income and the Sovereign Debt Paradigm
While the end of QT stabilizes liquidity, it does not resolve the structural fiscal dilemma: the sheer volume of U.S. deficit financing. Without the Fed actively reducing its inventory, the net supply of Treasuries hitting private markets declines by roughly $720 billion annually compared to peak runoff run rates. This provides much-needed relief to the long end of the yield curve, limiting runaway term-premia spikes and mitigating systemic yield volatility that typically suppresses private equity and venture capital valuation multiples.
People Also Ask (Frequently Asked Questions)
Why did the Federal Reserve decide to terminate Quantitative Tightening in late 2025?
The Fed terminated QT because institutional money-market plumbing reached its structural limits. The Overnight Reverse Repo (ON RRP) facility, which had acted as a multi-trillion-dollar shock absorber, was drained below $100 billion. This left bank reserve balances vulnerable to direct contraction. Confronted by widening SOFR-IORB spreads and volatile intraday repo markets, the Fed concluded QT to prevent a liquidity dislocation similar to the September 2019 repo crisis.
What is the Lowest Comfortable Level of Reserves (LCLoR), and why is it critical?
LCLoR refers to the aggregate dollar amount of reserves the commercial banking system requires to clear daily payments, satisfy internal risk models, and meet regulatory liquidity coverage mandates without experiencing funding panic. If total reserves plunge below this invisible threshold—historically estimated at between 10% and 11% of GDP—banks hoard cash, interbank lending freezes, and short-term interest rates spike unpredictably, disrupting broader economic transmission channels.
What is the operational difference between ending QT and resuming QE?
Ending QT represents a shift to a neutral balance-sheet posture, not an easing posture. By ending QT, the Fed ceases allowing its holdings of Treasuries and MBS to roll off without replacement; it now reinvests the principal of maturing debt into fresh issuance, keeping its total balance sheet flat. Quantitative Easing (QE), conversely, involves the deliberate, aggressive expansion of the balance sheet via net-new asset purchases designed to force long-term yields down and stimulate economic output.
How does the end of QT impact corporate borrowing and equity valuation multiples?
QT extracts baseline liquidity from the banking complex, driving up funding costs across corporate credit and elevating discount rates applied to future cash flows. When QT ends, commercial paper and corporate bond spreads typically compress as primary dealers free up balance-sheet capacity to underwrite private credit. For equities, lower structural yields reduce equity discount rates, generally supporting elevated valuation multiples for long-duration growth, enterprise software, and capital-intensive infrastructure companies.
Future Outlook: Navigating the Neutral Era and 2026 Milestones
The Federal Reserve’s pivot from balance sheet reduction to balance sheet maintenance initiates a delicate transitional era. SOMA managers are shifting toward a pure replacement strategy: reinvesting maturing Treasuries proportionally across the bill and coupon curve, while redirecting MBS prepayments into Treasuries to intentionally eliminate mortgage credit exposure from the central bank’s books over time.
Market participants must now pivot their surveillance from QT runoff caps to broader liquidity indicators. The key variables will be the U.S. Treasury’s quarterly refunding announcements, changes to the Treasury General Account (TGA) balance, and the utilization frequency of the Standing Repo Facility. By successfully drawing the line before systemic plumbing broke, the Federal Reserve has protected aggregate market liquidity. However, in an era marked by massive fiscal expansion and relentless sovereign issuance, Wall Street’s margin for error remains razor-thin.