Executive Takeaways
- Historic Pivot: Mega-cap technology conglomerates have slashed cash returns—measured by dividends and share buybacks as a percentage of operating cash flow—to their lowest levels in a decade and a half.
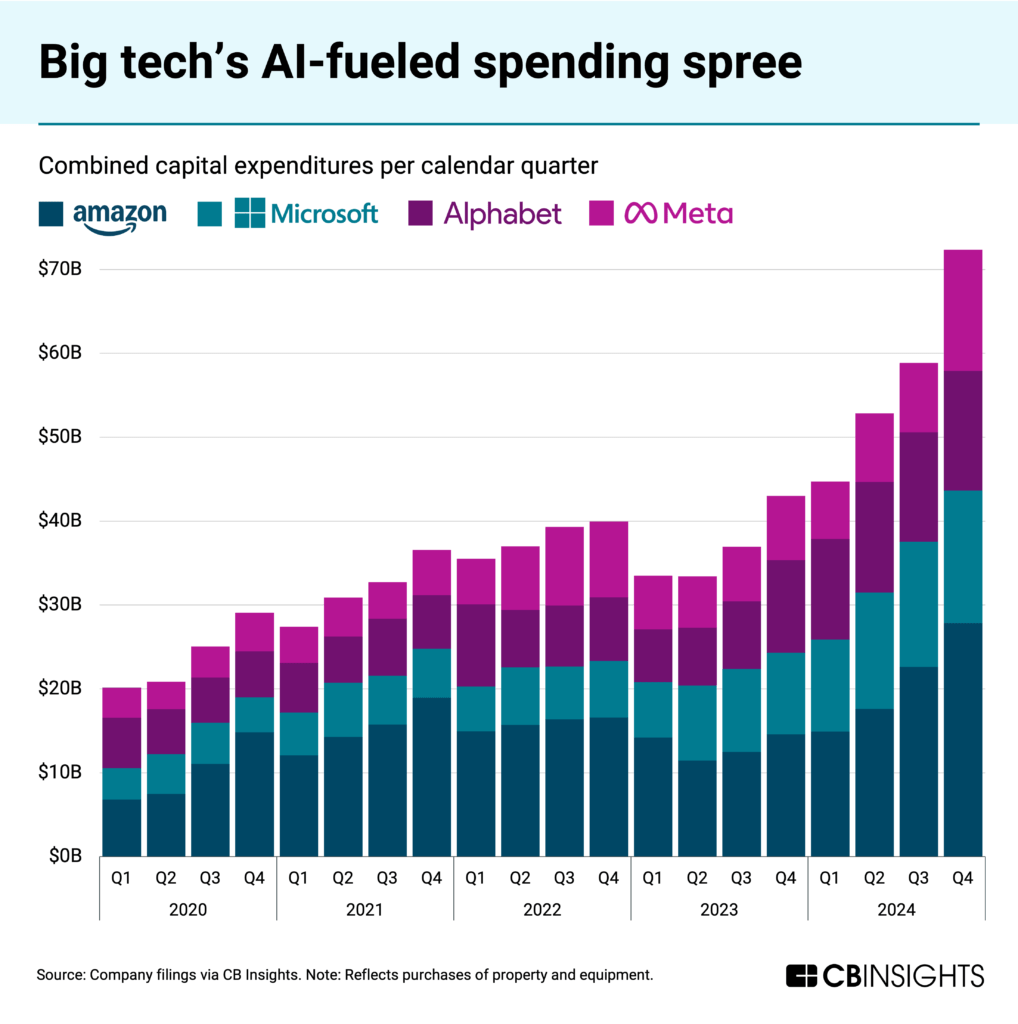
- The Capex Supercycle: Massive deployment into generative AI architecture, enterprise-grade GPU clusters, and custom silicon development has completely reordered corporate capital allocation priorities.
- Valuation Multiples at Risk: Wall Street analysts are reassessing traditional equity risk premiums as historical cash return safety nets are sacrificed for unproven long-term enterprise ROI in artificial intelligence.
- The Divergence Play: Institutional investors are separating infrastructure enablers from consumer-facing applications, sparking fierce debate over risk mitigation, cloud compute scalability, and free cash flow yields.
For more than a decade, the defining hallmark of the modern American technology monolith was an uncanny ability to generate tidal waves of liquidity while simultaneously returning record-shattering sums to institutional and retail investors. Through a combination of aggressive share repurchase authorizations and steadily escalating quarterly dividends, companies that once defined the speculative growth frontier evolved into the undisputed backbone of global portfolio income. That era has officially hit a historic inflection point.
According to comprehensive financial data compiled across SEC filings, Bloomberg aggregates, and wire reports, the largest technology enterprises—collectively comprising the dominant tier of the S&P 500 market capitalization—are now returning the smallest share of their cash to shareholders in 15 years. The culprit is not a sudden contraction in top-line revenue or a cyclical advertising slump, but rather a structural, capital-intensive arms race: the generative artificial intelligence boom.
As executive boards greenlight unprecedented budgets for data center expansion, high-voltage power procurement, and advanced semiconductor procurement, traditional shareholder remuneration has been relegated to the back burner. This deep-dive investigative report examines the mechanics of this historic capital reallocation, analyzing the strategic imperatives driving the shift, the implications for enterprise valuation multiples, and the long-term risk profile facing the world's most valuable corporations.
The Anatomy of the Capex Supercycle: From Buybacks to Silicon
Test Our Free AI & Tech Utilities Suite
Calculate LLM API token costs, analyze article dwell-time, or simulate tech DCA returns.
To understand why cash returns have plummeted to 15-year lows, one must examine the staggering velocity at which capital expenditure (Capex) has outpaced operating cash flow growth. Over the past twenty-four months, hyperscale cloud providers have transitioned from optimizing software-as-a-service margins to executing the most aggressive physical infrastructure buildout since the early expansion of the internet.
At the center of this transformation is the insatiable demand for high-performance computing clusters capable of training and running complex large language models (LLMs). Procurement cycles that once prioritized software scalability and low marginal costs have been replaced by multi-billion-dollar commitments to specialized processors, advanced liquid-cooling systems, and dedicated high-voltage electrical grids. To fund these initiatives without compromising balance sheet integrity, corporate treasuries have systematically dialed back open-market share buyback programs.
From a capital allocation perspective, Chief Financial Officers are making a calculated bet. Historically, share repurchases served as an effective mechanism for boosting earnings-per-share (EPS) and signaling managerial confidence during periods of market volatility. Today, however, executive compensation metrics and long-term enterprise survival strategies are increasingly tied to AI infrastructure dominance. Consequently, capital that would have historically been funneled into market liquidity is now being trapped on balance sheets or immediately deployed into physical assets with depreciating lifecycles.
Verified Data & Metrics Breakdown
The following table illustrates the dramatic shift in Big Tech financial metrics, comparing the current fiscal posture against historical medians over the past 15 years.
| Financial Metric | Historical Average (2010–2020) | Current Fiscal Year (TTM) | Strategic Driver / Implication |
|---|---|---|---|
| Cash Return Ratio (% of OCF) | 65% – 85% | 38% – 44% | Capital diverted to AI infrastructure and data center construction. |
| Combined Hyperscaler Capex | ~$60 Billion / Year | > $220 Billion (Projected) | Exponential increase in hardware procurement and energy costs. |
| Free Cash Flow (FCF) Yield | 4.5% – 6.0% | 2.1% – 3.2% | Pressure on equity valuation multiples and dividend growth safety. |
| Share Buyback Volume | Steady Quarterly Expansion | Selective & Conservative | Preservation of market liquidity for strategic capex obligations. |
Industry & Market Implications: Winners, Losers, and Economic Reordering

The abrupt contraction in shareholder cash distributions carries profound ramifications across global financial markets. As the investment community absorbs the reality of this capital pivot, distinct structural winners and losers are emerging across the macroeconomic landscape.
The Winners: Infrastructure Enablers and Semiconductor Giants
The primary beneficiaries of this capital flight away from equity buybacks are the specialized hardware manufacturers, semiconductor foundries, energy providers, and networking equipment developers powering the AI buildout. Companies sitting at the intersection of advanced silicon fabrication and high-bandwidth memory are experiencing unprecedented pricing power. For these firms, Big Tech's reduced appetite for stock buybacks is a welcome trade-off, as every dollar withheld from shareholders is directly funneled into their order books.
The Losers: Income-Focused Institutional Portfolios and Equity Holders
Conversely, institutional pension funds, endowment managers, and retail income investors are absorbing the brunt of this adjustment. For over a decade, technology equities functioned as a dual-engine asset class, offering both aggressive capital appreciation and dependable, expanding dividend streams. With dividend payout ratios stalling and buyback programs facing stringent prioritization hurdles, the total shareholder yield of the tech sector has compressed significantly, forcing portfolio managers to reevaluate asset allocation models and risk mitigation strategies.
The Regulatory and Economic Crossroads
Beyond Wall Street trading desks, this massive reallocation of corporate cash touches upon broader regulatory and geopolitical themes. Antitrust watchdogs and policymakers have historically scrutinized massive share repurchase programs, arguing that capital deployed into stock buybacks represents a failure to invest in domestic productive capacity, workforce development, or research and development.
In a twist of irony, Big Tech's current strategy directly addresses that critique—albeit through the lens of artificial intelligence dominance rather than labor expansion. By pouring hundreds of billions of dollars into domestic data centers, proprietary silicon, and next-generation cloud compute architecture, these corporations are insulating themselves against technological obsolescence while navigating intense global regulatory scrutiny.
However, this strategy introduces new systemic vulnerabilities. If enterprise ROI on artificial intelligence fails to materialize at the scale projected by corporate executives, the massive capital outlays currently eroding free cash flow yields could result in severe valuation corrections. Wall Street's patience, while currently anchored by the transformative promise of generative AI, has strict quantitative limits.
Frequently Asked Questions (People Also Ask)
Why are tech companies cutting share buybacks and dividends now?
Answer: Technology conglomerates are reducing cash returns to shareholders because the capital requirements for building generative AI infrastructure have reached unprecedented levels. Funding massive data center construction, high-voltage power arrangements, and advanced semiconductor procurement requires vast amounts of liquidity, forcing corporate treasuries to prioritize capital expenditures over open-market stock repurchases and dividend growth.
How does this shift impact long-term enterprise valuation multiples?
Answer: Traditionally, high cash returns and robust free cash flow yields supported premium equity valuation multiples. As capital is diverted into long-term infrastructure projects with uncertain near-term enterprise ROI, equity research analysts are recalibrating valuation models to account for lower immediate liquidity, increasing the sensitivity of stock prices to actual AI monetization metrics.
Are all big tech companies equally guilty of reducing shareholder cash returns?
Answer: No. While the sector-wide trend reflects a 15-year low in overall cash return ratios, the degree of reduction varies significantly. Hyperscalers heavily invested in foundational model training and cloud infrastructure are cutting buybacks more aggressively, whereas firms with diversified revenue streams and less direct exposure to heavy infrastructure spending are maintaining more balanced capital allocation policies.
What are the primary risks associated with this heavy AI capital expenditure?
Answer: The principal risks include capital misallocation, technological obsolescence of early-stage hardware, insufficient monetization of enterprise AI software, and margin compression. If the anticipated demand for AI-driven enterprise applications fails to match the scale of infrastructure investments, companies could face prolonged pressure on their free cash flow and return on invested capital (ROIC).
Future Outlook: Milestones and Metrics to Watch
As the tech sector navigates this capital-intensive transition, institutional investors and market observers must monitor several critical forward-looking indicators. The coming quarters will separate rhetoric from financial reality as corporate boards report on actual utilization rates, revenue conversion, and margin stability.
- Cloud Revenue Accretion: Watch for explicit revenue breakdowns demonstrating that AI workloads running on newly constructed data centers are generating sustainable, high-margin top-line growth rather than merely offsetting legacy compute declines.
- Free Cash Flow Inflection Points: Track whether operating cash flow growth can outpace scheduled capital expenditure commitments, signaling a potential future return to normalized share buyback and dividend expansion schedules.
- Energy and Infrastructure Bottlenecks: Monitor regulatory approvals, power purchase agreements (PPAs), and supply chain lead times for advanced networking hardware, which represent the primary operational bottlenecks governing capital deployment velocity.
- Enterprise ROI Metrics: Pay close attention to B2B adoption rates and enterprise software pricing power, as these figures will ultimately validate or undermine the economic thesis supporting the current capex supercycle.
The era of effortless, high-yield cash returns subsidized by lean software models has yielded to a high-stakes, capital-heavy infrastructure race. Whether this strategic pivot secures the long-term dominance of the current technological elite or strains balance sheets beyond sustainable limits remains the defining financial question of the decade.