The Zero-Bear Paradox: Why Every Major Wall Street Desk Just Forecasted a 2026 Equity Melt-Up—And the Trillion-Dollar Asymmetric Risk Looming Beneath
Executive Takeaways
- Unprecedented Unanimity: For the first time in over two decades of financial polling, all 21 Wall Street equity strategists surveyed by Bloomberg News predict positive net equity returns for the S&P 500 in 2026, with zero desks modeling a year-over-year contraction.
- The Valuation Disconnect: The consensus bullishness relies on an aggressive composite forward S&P 500 EPS projection exceeding $305, premised on enterprise AI infrastructure transitioning from capital-expenditure drag to accretive free cash flow generation.
- Monolithic Crowding: Portfolio allocation metrics indicate historical highs in long-equity concentration, with institutional cash reserves dropping below 3.9%, leaving institutional liquidity buffers dangerously thin in the event of an exogenous macro shock.
- The Asymmetric Skew: With trailing price-to-earnings multiples hovering above the 90th historical percentile and equity risk premiums near zero, contrarian risk desks warn that total consensus alignment historically correlates with violent volatility repricing rather than orderly compounding.
The Anatomy of Absolute Consensus
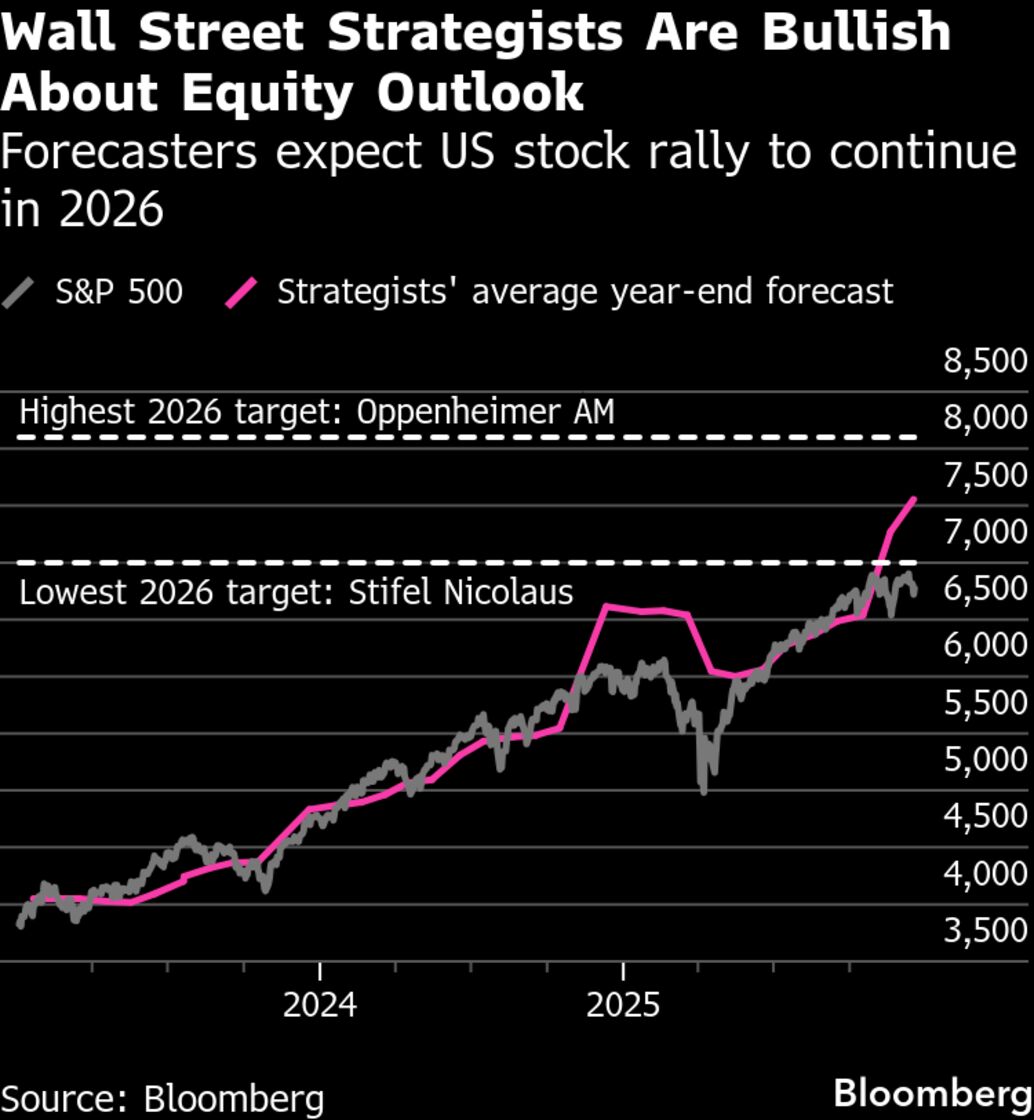
In the closing trading days of 2025, Wall Street achieved an extraordinary and mathematically rare milestone: total, unreserved unanimity. According to Bloomberg News' definitive annual survey of 21 tier-one sell-side institutions—ranging from Goldman Sachs and JPMorgan Chase to Morgan Stanley, Bank of America, and Deutsche Bank—not a single chief equity strategist is modeling a negative annual return for the S&P 500 in 2026.
The median projection calls for the benchmark index to grind higher by an additional 9.5% to 14%, with the most aggressive desks projecting the gauge to pierce 7,100 by the fourth quarter of 2026. This uniformity does not merely represent a bullish tilt; it marks the total extinction of the institutional bear. In a market architecture traditionally anchored by adversarial tension between short-sellers, value realists, and momentum allocators, the eradication of negative forecasts signals a profound structural shift in how sell-side desks quantify systemic risk, capital allocation, and valuation multiples.
Historically, when the sell-side consensus reaches 100% directional alignment, the market approaches a critical inflection point. In late 1999, unanimous tech-sector cheerleading preceded a multi-year valuation unwinding. In late 2007, structural mortgage fragility was dismissed across institutional year-ahead outlooks. While today’s balance sheets possess significantly higher cash cushions and structural interest coverage than during those crises, the complete disappearance of downside projections across 21 institutional desks exposes a dangerous operational risk: when all participants are positioned for expansion, marginal buyers become scarce, and even minor earnings revisions can catalyze outsized market drawdowns.
The Macro Engine: Earnings Acceleration, Fed Architecture, and Enterprise ROI
To understand how 21 independent quantitative and qualitative teams arrived at an identical directional thesis, one must dissect the three structural pillars dominating Wall Street's institutional models for 2026: corporate balance sheet resilience, monetary policy recalibration, and enterprise software productivity yields.
1. The Enterprise AI Monetization Inflection
Between 2023 and 2025, mega-cap balance sheets deployed over $380 billion into cloud compute architecture, custom silicon, and hyperscale data center infrastructure. Sell-side models for 2026 treat this capital expenditure not as a speculative sunk cost, but as an operational leverage trigger. Desks project that tier-one enterprises will realize accelerated margin expansion as software vendors, enterprise automation platforms, and generative workflows reduce labor overhead and compress operating ratios. The consensus expectation mandates that operating margins for S&P 500 non-financial firms will expand by 85 basis points in 2026, driving corporate operating profits to record highs.
2. Federal Reserve Liquidity and Rate Neutrality
Following the monetary easing trajectory initiated in late 2024, the Federal Reserve is projected to settle the federal funds rate into a neutral policy band between 3.25% and 3.75%. Wall Street models assign an exceptionally low probability to a resurgence of headline inflation, assuming stable terminal rates will compress corporate borrowing spreads and reopen high-yield refinancing windows. This stability provides corporate treasuries with predictable debt service costs, enabling a resurgence of debt-funded share repurchase programs and strategic M&A activity.
3. The Private Capital and Liquidity Siphon
Institutional strategists point to a global liquidity overhang. Trillions of dollars parked in money market instruments, sovereign wealth funds, and private credit vehicles are facing reinvestment risk as front-end yields compress. Desks argue that this capital has virtually no alternative but to re-enter liquid public equities, specifically high-free-cash-flow-conversion equities that offer both inflation protection and reliable dividend growth.
Data Matrix: 2026 Wall Street Consensus Targets & Valuation Baselines
A granular examination of the survey data exposes the narrow dispersion of expectations across major desks. The standard deviation among 2026 year-end targets is among the tightest recorded since the global financial crisis.
| Brokerage Desk / Firm | 2026 S&P 500 Target | Projected 2026 EPS | Implied Forward P/E | Core Bull Catalyst | Identified Tail Risk |
|---|---|---|---|---|---|
| Goldman Sachs | 6,800 | $300 | 22.6x | Enterprise AI productivity gains; broad-market EPS recovery | Tariff escalation; persistent wage inflation |
| Morgan Stanley | 6,650 | $296 | 22.4x | Operating margin resilience; corporate cycle expansion | Federal deficit pressures pushing long-dated yields higher |
| JPMorgan Chase | 6,500 | $292 | 22.2x | Private capital rotation; Fed liquidity baseline | Geopolitical supply chain disruptions; energy shocks |
| Bank of America | 6,750 | $305 | 22.1x | Re-acceleration in corporate capex; software cash conversion | Valuation multiple fatigue; crowded positioning |
| Deutsche Bank | 7,000 | $315 | 22.2x | Global synchronization of industrial and consumer demand | Sovereign bond yield volatility; consumer credit exhaustion |
| Consensus Median (21 Desks) | 6,750 | $302 | 22.3x | Structural earnings expansion across mid- and mega-caps | Multiple contraction triggered by higher neutral real rates |
The Danger of Monolithic Positioning: The Contrarian Threat
The fundamental risk of a market where every institutional strategist is bullish does not necessarily stem from an intrinsic microeconomic failure; it stems from market microstructure and positioning dynamics. When the collective consensus models positive returns, institutional portfolios are mandated to align with that view.
As of late December 2025, active asset managers have systematically drawn down their dry powder. Cash allocations at mutual funds and hedge funds have reached historical lows, while equity beta exposure sits in the 98th percentile. In derivatives markets, the cost of downside protection—measured by the skew on S&P 500 out-of-the-money put options versus calls—reflects widespread complacency. Market participants are not buying insurance because institutional research departments have rendered disaster scenarios mathematically obsolete.
This dynamic creates an acute vulnerability: the "monolithic trade." If corporate earnings come in flat rather than expanding by the projected 11% to 13%, the justification for a forward P/E multiple of 22.3x completely evaporates. A multiple contraction from 22.3x down to its 20-year average of roughly 17.5x would require an immediate, violent 21% correction in index valuations, even if headline earnings meet current baseline levels. In short, the market has priced in perfection across every macroeconomic variable: geopolitical stability, frictionless AI infrastructure deployment, persistent consumer solvency, and steady monetary easing.
Industry & Market Implications: Who Wins, Who Loses?
The unanimous forecast assumes an environment characterized by broad market participation, transitioning away from the hyperscaler-only rally that dominated prior cycles. However, beneath the surface of the broad index projections, individual market segments face radically diverging paths.
The Primary Beneficiaries
- Enterprise Software and Cloud Infrastructure Enablers: Software companies that successfully bundle AI workflows into recurring subscription tiers without margin degradation stand to generate massive cash flows, justifying high enterprise multiples.
- Tier-1 Investment Banks and M&A Advisory Desks: With predictable rates and high corporate valuation currency, cross-border M&A, private equity divestments, and enterprise recapitalizations are projected to rebound sharply, reviving institutional advisory fee pools.
- Quality Cyclicals and Industrial Automation: Infrastructure modernization, reshoring initiatives, and grid electrification continue to guarantee multi-year order backlogs for capital goods manufacturers.
Sectors at High Risk of Disappointment
- Highly Leveraged, Low-Cash Small Caps: Despite predictions of a small-cap renaissance, firms dependent on floating-rate debt or short-term credit lines will face sustained margin pressure if the Federal Reserve pauses rate cuts around 3.5% rather than easing further.
- Defensive Utilities and Sovereign Debt Substitutes: If the 100% bullish equity consensus holds, defensive bond proxies will suffer persistent capital outflows as allocators chase active equity beta and risk-on returns.
- Consumer Discretionary Reliant on Subprime Credit: Middle- and lower-income consumer balance sheets exhibit escalating delinquency rates across auto loans and credit cards. Companies exposed to non-prime consumer spending may fail to participate in the projected earnings expansion.
Frequently Asked Questions (People Also Ask)
Is Wall Street’s unanimous bullishness a contrarian sell signal?
Historically, absolute unanimity among Wall Street desks serves as a severe warning indicator of crowded institutional positioning. While unanimous bullishness does not automatically trigger an immediate market drop, it implies that positive fundamental catalysts are already priced into equities. When no institutional desks are modeling a decline, unexpected negative macroeconomic, regulatory, or geopolitical developments can trigger severe downward volatility because institutional cash buffers are depleted and hedging levels are low.
What S&P 500 price levels are strategists targeting for 2026?
According to the Bloomberg News survey, the 21 institutional desks project the S&P 500 to finish 2026 between 6,500 on the conservative end (JPMorgan Chase) and 7,100 on the aggressive end, establishing a median target of 6,750. These targets imply a price gain between 9% and 15% from late 2025 trading levels, driven primarily by an anticipated corporate EPS baseline of $292 to $315.
How does enterprise AI spending factor into the 2026 consensus rally?
The bull case for 2026 relies on the premise that corporate capital expenditures on AI compute infrastructure (chips, cloud servers, and data centers) between 2023 and 2025 will transition from an expense item to an operational leverage catalyst. Wall Street models project that automated workflows and enterprise software enhancements will expand net corporate margins by 70 to 100 basis points across non-tech sectors, driving broad-based earnings growth across traditional industries.
What black swan risks could derail the 2026 market projections?
The primary threats to the consensus 2026 rally include: (1) a structural rebound in inflation driven by geopolitical trade tariffs, which would force central banks to pause or reverse interest rate cuts; (2) sovereign debt supply gluts driving long-term Treasury yields back toward 5%, which would compress equity valuation multiples; and (3) enterprise software productivity delays, where corporate AI implementations fail to generate the projected ROI needed to support premium market multiples.
Future Outlook: Strategic Milestones to Watch in 2026
As markets transition into the 2026 fiscal year, institutional investors must verify whether the sell-side's pristine assumptions match real-world financial realities. The first major stress test will arrive in late January and February 2026 during the Q4 2025 earnings reporting cycle. Markets will scrutinize full-year 2026 guidance, focusing on whether hyperscale tech companies sustain capital expenditures while non-tech companies validate accelerating productivity gains.
The second critical juncture involves the Federal Open Market Committee's (FOMC) mid-year rate trajectory. If the neutral rate settles higher than expected—driven by ballooning sovereign debt issuance and sticky services inflation—valuation multiples will face immediate downward pressure. Should long-term bond yields spike, equity multiples trading at 22x forward earnings will face mathematical headwinds against guaranteed fixed-income returns.
Wall Street’s 21-for-21 bullish unanimity paints a flawless portrait of corporate endurance, liquidity normalization, and technological productivity. However, seasoned institutional allocators recognize that markets are governed by the management of asymmetric risk. When an entire trading floor stands on the same side of the ship, the greatest threat is rarely the iceberg everyone is monitoring—it is the unexpected swell that destabilizes a market positioned exclusively for smooth sailing.