Executive Takeaways
- Equity Futures Firm Ahead of the Bell: S&P 500 futures ticked higher alongside Nasdaq 100 and Dow Jones Industrial Average contracts, driven by selective pre-market positioning as institutional capital prepares for Q1 earnings reports from money center heavyweights.
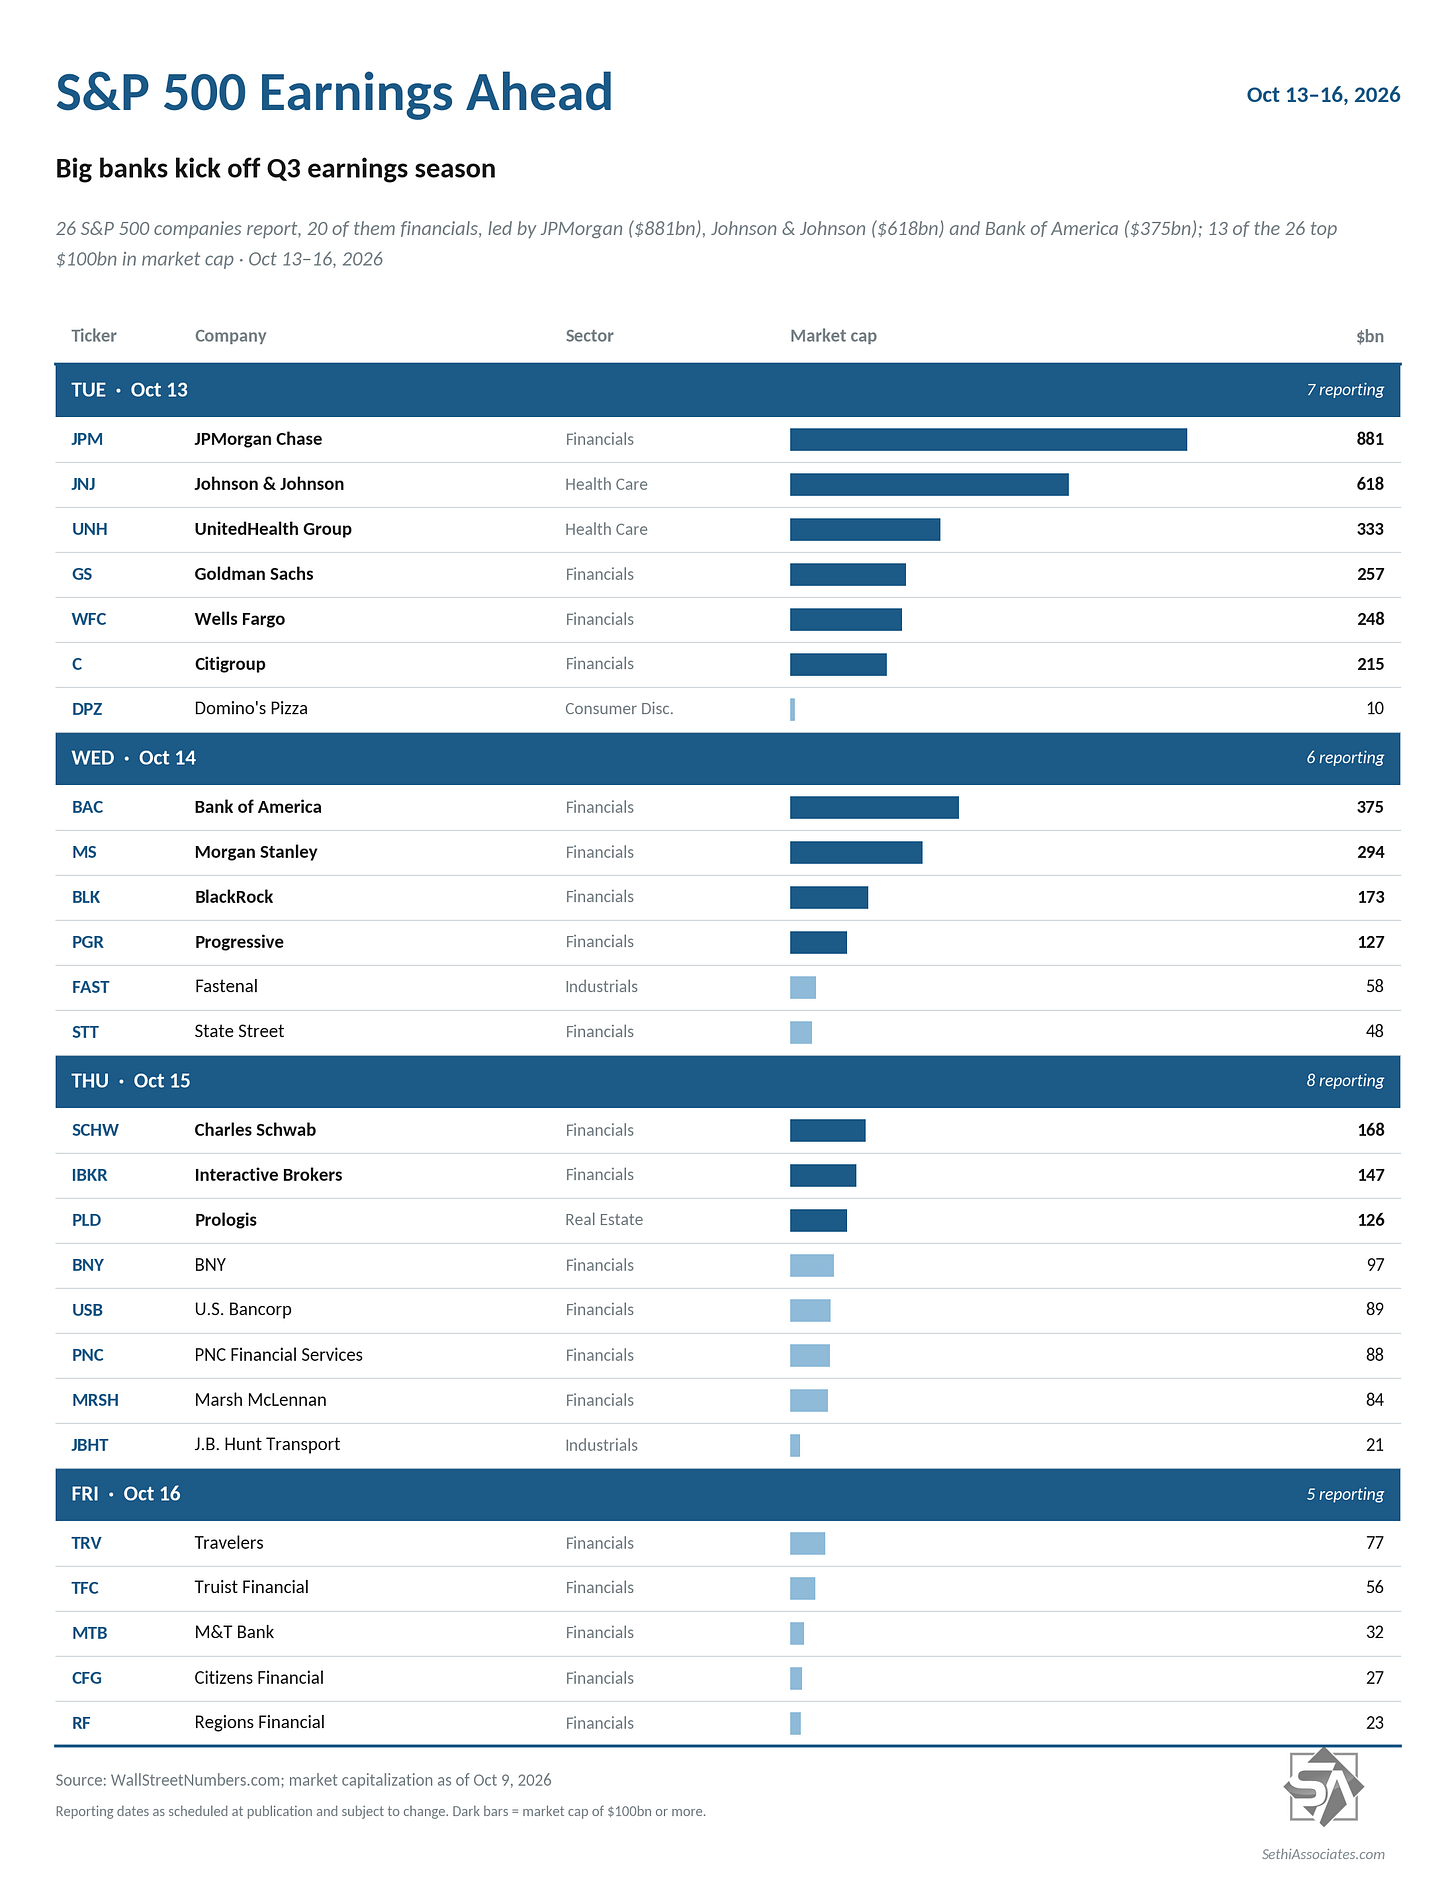
- The Money Center Litmus Test: JPMorgan Chase (NYSE: JPM), Wells Fargo (NYSE: WFC), and Citigroup (NYSE: C) lead an earnings slate expected to reveal the degree to which elevated deposit betas, shifting Net Interest Margins (NIM), and credit loss normalization are squeezing core operational profits.
- Capital Markets vs. Balance Sheet Compression: A broad-based revival in investment banking underwriting (DCM/ECM) and cross-border advisory is primed to cushion institutional bottom lines, even as commercial real estate (CRE) vulnerabilities and consumer credit card charge-offs demand higher provisioning.
- Macroeconomic Divergence: With interest rate cut expectations from the Federal Reserve pushed further out along the sovereign yield curve, corporate executives face intense scrutiny over balance sheet durability, capital allocation discipline, and revised full-year guidance.
The Pre-Bell Pivot: Equity Futures and the Earnings Landscape

Global equity markets pivoted toward measured risk-on positioning this morning, with S&P 500 futures gaining traction as market participants calibrated their exposures ahead of the opening salvo of bank earnings. The modest advance across equity futures reflects a tentative calm across sovereign debt markets, where the 10-year Treasury yield consolidated around key technical resistance levels, giving multi-asset allocators an opening to rotate liquidity back into blue-chip equity proxies.
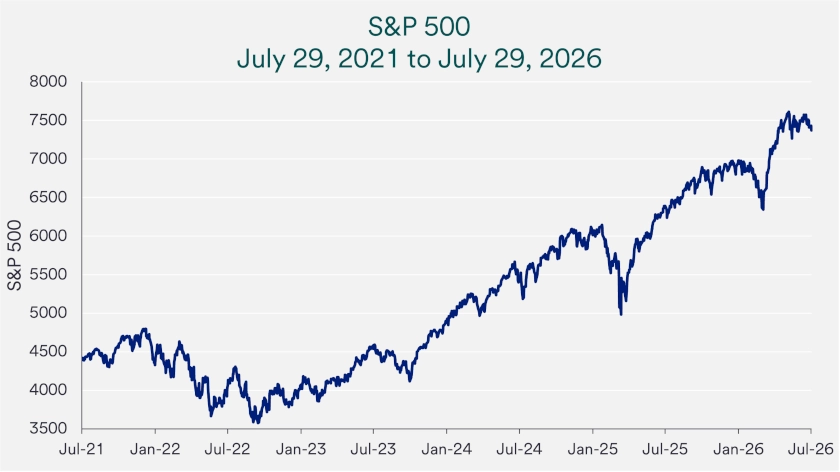
The initiation of the earnings cycle arrives at an inflection point for the broader market rally. While the S&P 500’s advance over recent quarters was largely propelled by multiple expansion in mega-cap technology and generative artificial intelligence pure-plays, the fundamental baton is now passing back to corporate profitability, capital expenditure trajectory, and enterprise solvency. Equity valuations—sitting at elevated forward price-to-earnings multiples relative to historical five- and ten-year averages—leave little margin for operational execution errors or pessimistic forward-looking guidance.
For institutional desks, the banking sector serves not merely as an isolated industry grouping, but as the critical circulatory system of the domestic and global economy. The financial health of national money-center institutions offers an unvarnished, real-time diagnostic of consumer balance sheets, corporate borrowing demand, liquidity dynamics, and systemic underwriting exposure under a prolonged "higher-for-longer" monetary regime.
The Money Center Bellwethers: Dissecting the Q1 Balance Sheet Prints
JPMorgan Chase, the nation’s largest financial institution by assets under management, enters the print as the primary benchmark for banking resilience. Under the leadership of Jamie Dimon, the bank has consistently leveraged its fortress balance sheet, scale advantages, and deposit capture to outperform peers. However, institutional analysts are zeroing in on whether JPMorgan can sustain its extraordinary Net Interest Income (NII) run rate. As deposit migration toward high-yielding Treasury alternatives and certificates of deposit (CDs) matures, funding costs have crept incrementally higher, applying inevitable pressure to historical NIM peaks.
Simultaneously, Wells Fargo faces a distinct operational test. The bank remains constrained by its ongoing regulatory asset cap, focusing executive efforts on internal efficiency ratios, expense reduction initiatives, and balance sheet pruning. Analysts will scrutinize Wells Fargo’s exposure to multi-family and commercial real estate properties, particularly office buildings located in metropolitan central business districts, where debt refinancing dynamics continue to demand elevated loan-loss reserves.
Citigroup, led by CEO Jane Fraser, represents the fundamental turnaround narrative of the money-center cohort. In the midst of a multi-year organizational restructuring aimed at eliminating structural managerial layers, divesting non-core international consumer franchises, and streamlining institutional operations, Citigroup’s results will be measured against its progress toward structural return on tangible common equity (ROTCE) targets. Investors are seeking concrete evidence that restructuring charges are tapering off and that core operational profitability is sustainably improving.
The Underwriting Resurgence: Capital Markets Rebounding Against Credit Headwinds
A primary bright spot on institutional desks is the anticipated rebound in non-interest fee income. Following an extended drought characterized by stalled initial public offerings (IPOs), depressed corporate bond issuance, and subdued mergers and acquisitions (M&A), green shoots within the investment banking pipeline have begun materializing into realized revenues.
With corporate balance sheets requiring structural refinancing and corporate boards adjusting to stabilized cost-of-capital realities, both debt capital markets (DCM) and equity underwriting desks have seen transaction volumes accelerate. The strategic shift among corporate CFOs to tap corporate bond markets—locking in long-term liquidity despite elevated coupons—has generated meaningful fee expansion for institutional syndicates. Moreover, strategic corporate transformations, joint ventures, and sponsored private-equity exits are slowly unlocking, providing vital revenue diversification to mitigate the plateau of Net Interest Income.
Conversely, credit underwriting teams face mounting challenges within retail portfolios. Consumer charge-offs, particularly across prime and subprime credit card portfolios, have steadily accelerated toward—and in several cases surpassed—pre-pandemic baselines. High inflation rates over consecutive years have drained pandemic-era excess consumer savings, leading lower- and middle-income demographics to increasingly tap revolving credit lines to support baseline expenditures. The consequential rise in 30- and 90-day delinquencies requires risk management committees to step up allowance for credit losses (ACL) under Current Expected Credit Losses (CECL) accounting frameworks.
Verified Data: Big Bank Consensus Projections & Key Performance Indicators
The following institutional tracking metrics outline consensus estimates, risk reserves, and structural regulatory capital metrics entering the current reporting window across the premier Tier-1 global systemically important banks (G-SIBs):
| Financial Institution | Consensus EPS (Est.) | Projected Net Interest Income (NII) | CET1 Capital Ratio (Target/Actual) | Key Metric / Segment Focus |
|---|---|---|---|---|
| JPMorgan Chase & Co. (JPM) | $4.15 – $4.22 | ~$22.8 Billion | 15.0% | Full-year NII guidance, deposit beta retention, CIB advisory recovery |
| Wells Fargo & Co. (WFC) | $1.08 – $1.15 | ~$12.2 Billion | 11.4% | Asset cap timeline updates, CRE office provisions, efficiency ratio |
| Citigroup Inc. (C) | $1.18 – $1.25 | ~$13.1 Billion | 13.4% | Services revenue momentum, restructuring execution costs, ROTCE roadmap |
| Bank of America Corp. (BAC) | $0.76 – $0.81 | ~$14.0 Billion | 11.8% | Held-to-maturity (HTM) portfolio yield adjustments, consumer asset quality |
| Goldman Sachs Group (GS) | $8.50 – $8.75 | ~$1.5 Billion (Fee Driven) | 14.5% | FICC & Equities trading flow, M&A pipeline monetization, asset management marks |
| Morgan Stanley (MS) | $1.65 – $1.72 | ~$1.8 Billion (Fee Driven) | 15.2% | Net new wealth management assets (NNA), institutional advisory, asset velocity |
Industry & Market Implications: Who Wins, Who Loses
The divergence in fundamental balance sheet mechanics among financial institutions is delineating clear operational winners and losers across the market landscape:
- The Strategic Winners: Mega-cap universal banks with scale-driven, diversified non-interest revenue franchises (such as asset and wealth management, payments processing, and institutional custody) are insulated against shifting rate trajectories. Institutions capable of funding their operations via sprawling, low-cost operational commercial deposits can maintain healthy spreads while regional peers compete intensely on pricing.
- The Capital Markets Contenders: Pure-play and dominant investment banking firms are positioned to capitalize on a resurgent corporate finance environment. As private equity sponsors face growing pressure from limited partners to return capital, monetization events—including secondary offerings, carve-outs, and strategic sales—are slated to drive high-margin advisory fees straight to firm operating bottom lines.
- The Structural Losers: Mid-tier regional banks with concentrated commercial real estate (CRE) debt portfolios and elevated non-interest-bearing deposit outflows remain at a competitive disadvantage. These institutions are forced to access high-cost Federal Home Loan Bank (FHLB) borrowings and brokered deposits, crimping profitability and capping capital deployment initiatives such as share buyback authorizations.
Regulatory Capital Overhang: The Basel III Endgame Debate
Beyond current quarterly income metrics, boardroom discussions are heavily occupied by ongoing regulatory shifts surrounding the proposed Basel III Endgame framework. The original rules outlined by the Federal Reserve, the Federal Deposit Insurance Corporation (FDIC), and the Office of the Comptroller of the Currency (OCC) suggested a significant hike in Common Equity Tier 1 (CET1) capital requirements for banks with over $100 billion in total assets.
However, aggressive pushback from the banking sector—highlighting the potential to dampen domestic credit formation, curtail market liquidity, and push lending activities into opaque shadow banking channels—has forced financial regulators to reconsider the rule’s final scope. Market participants are listening closely to executive conference calls for signals regarding potential regulatory concessions. Any substantial dilution or phased delay of the capital requirement changes would free up billions of dollars in trapped institutional capital, directly opening the door for expanded share repurchases and enhanced dividend distribution profiles heading into the second half of the year.
Frequently Asked Questions (People Also Ask)
Why do money center bank earnings set the direction for the broader S&P 500?
Financial institutions act as the structural bellwethers of economic health. Because bank balance sheets touch every sector—spanning consumer credit cards, industrial capital investments, residential mortgages, and enterprise liquidity facilities—their earnings reports provide definitive insight into aggregate corporate revenue trajectory, consumer payment health, and systemic credit risk across the broader economy.
What is the significance of Net Interest Margin (NIM) in the current rate environment?
Net Interest Margin measures the differential between the interest income a financial institution generates from loans, securities, and investments against the interest cost it distributes to depositors and wholesale funding providers. In a prolonged high-rate climate, banks face upward pressure on "deposit betas," forcing them to lift deposit yields to prevent capital flight, which gradually compresses their structural profit margins.
How are commercial real estate (CRE) concerns affecting Tier-1 bank balance sheets?
While mega-cap money center institutions maintain vastly more diversified loan portfolios than smaller regional banks, commercial office properties have experienced sharp valuation write-downs due to post-pandemic remote work models and elevated debt refinancing costs. Major banks have steadily expanded their provisions for credit losses, establishing targeted accounting reserves to absorb forecasted non-performing loan restructurings and defaults.
How does the performance of investment banking fees affect financial sector valuations?
Investment banking advisory and underwriting fees represent high-margin, capital-light non-interest income. When M&A and IPO volumes rebound, this revenue directly enhances return on equity (ROE) and return on tangible common equity (ROTCE) metrics without requiring corresponding expansions in risk-weighted balance sheet assets, commonly catalyzing equity valuation multiple expansion for institutional banks.
Future Outlook & Institutional Watchlist
As the opening bell draws near, market participants must maintain a data-driven focus on specific forward-looking operational metrics. In the near term, corporate commentary surrounding full-year NII projections will serve as the primary catalyst for immediate sector price action. A conservative posture from corporate treasurers regarding future net margins could check broader equity momentum, whereas resilient guidance will validate prevailing valuation multiples across the financial complex.
Over the medium term, trading desks are watching the secondary effects on broad market liquidity. If major bank earnings confirm that the US consumer remains resilient and that corporate credit demand is accelerating, market pricing for Federal Reserve rate cuts may see further consolidation into late 2024 or early 2025. Conversely, an unexpected surge in credit card charge-offs or accelerated commercial real estate provisioning could rapidly revive growth concerns, altering broader equity positioning.
The performance of the nation's premier banking institutions this week will fundamentally set the tone for the entire Q1 corporate reporting season. With equity indices perched near historic highs and monetary easing cycles hanging in the balance, Wall Street's reporting gauntlet will decisively demonstrate whether institutional fundamentals can support the prevailing market optimism.