Executive Takeaways
Test Our Free AI & Tech Utilities Suite
Calculate LLM API token costs, analyze article dwell-time, or simulate tech DCA returns.
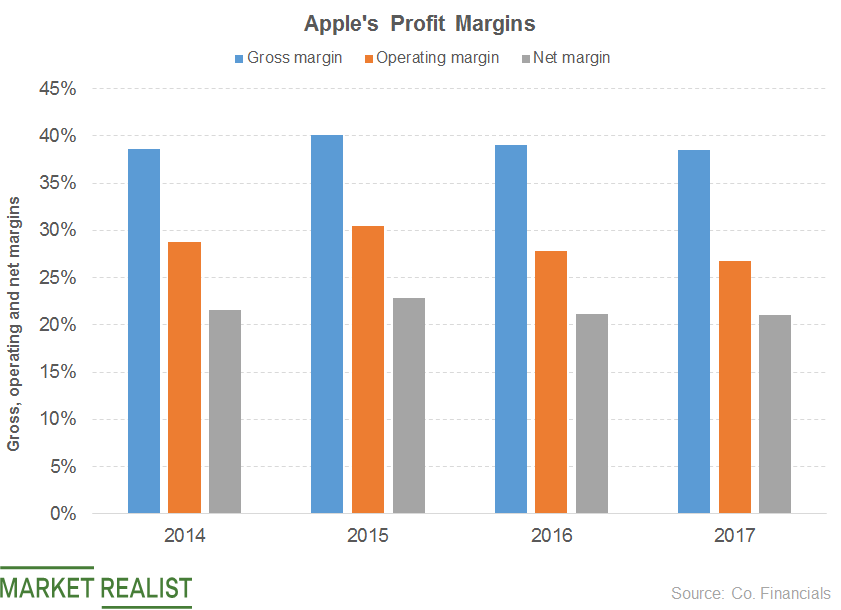
- Margin Focus Point: Wall Street equity futures and global macro funds are hyper-focused on Apple Inc.’s blended gross margin trajectory, targeting a key 45.5% to 46.5% threshold to justify current forward valuation multiples.
- Structural Segment Divergence: While hardware gross margins face input cost inflation from next-generation semiconductor nodes (TSMC 3nm process) and memory spot rate surges, the Services division delivers record 74%+ gross margins to cushion consolidated corporate yields.
- Macro Risks in Greater China: Aggressive promotional discounting in East Asia and local currency fluctuations present immediate friction to Hardware Average Selling Prices (ASPs), testing supply chain efficiency.
- AI Infrastructure & CapEx Balancing: As Apple accelerates its on-device and private cloud "Apple Intelligence" architecture, market liquidity conditions depend on management’s ability to scale enterprise compute capability without diluting operating margins.
The Margin Crucible: Wall Street’s Morning Bid Focus

As global equity desks recalibrate exposure ahead of the upcoming earnings cycle, the financial press and institutional trading desks are locked in on a single pivotal metric: Apple Inc.’s gross margin resilience. In early global trading, equity index futures swung tightly around baseline expectations as traders evaluated whether the world’s largest enterprise consumer tech entity can hold the line against hardware margin compression while scaling high-margin ecosystem recurring revenue.
For institutional capital allocators, the equation extends beyond top-line revenue velocity. Apple’s valuation—currently trading at an elevated enterprise value-to-EBITDA multiple relative to its ten-year historical mean—demands pristine profitability metrics. Over the past three fiscal quarters, global macroeconomic turbulence, characterized by sticky input inflation, fluctuating cross-border foreign exchange rates, and aggressive competitor pricing strategies in key growth markets like Greater China, has tested the resilience of Apple’s legendary supply chain management.
The core tension dominating the morning financial bid centers on whether efficiency gains within the company’s capital allocation strategy can absorb higher component costs, or whether consumer price sensitivity will restrict hardware average selling prices (ASPs) across flagship device lineups.
Decoupling Hardware and Services: The Financial Anatomy
To analyze Apple’s gross margin profile effectively, institutional investors decouple the corporate architecture into two distinct, highly interdependent operating models: the legacy Hardware segment (iPhone, Mac, iPad, Wearables) and the high-yield Services ecosystem (App Store, iCloud, Apple Pay, Licensing, and Subscription Media).
1. Hardware Gross Margin Dynamics & Silicon Overhead
Hardware operations remain the dominant revenue volume generator, but component procurement economics have turned complex. The transition to advanced silicon packaging—specifically Taiwan Semiconductor Manufacturing Company’s (TSMC) N3E and trailing-edge 3-nanometer architecture—has pushed silicon wafer unit costs sharply upward. Concurrently, global DRAM and NAND flash memory spot pricing experienced cyclical rebounds, directly squeezing bill-of-materials (BOM) margins for base-tier hardware variants.
To mitigate this structural cost creep, Apple’s enterprise procurement strategy relies heavily on tier-mix optimization. By widening the feature gap between standard models and higher-margin Pro and Pro Max variants, the company successfully drives upside in overall ASPs. However, in key international regions, local currency depreciation against the US dollar has forced management to absorb localized cost spikes or risk demand destruction through upfront price hikes.
2. The High-Yield Services Buffer
Offsetting hardware cost pressures is Apple’s rapidly scaling Services segment. Generating gross margins consistently north of 74%, Services acts as an economic shock absorber for the overall corporate profit-and-loss statement. Every incremental dollar of Services revenue—derived from cloud compute storage upgrades, transactional fees within the financial services ecosystem, and lucrative search distribution contracts—delivers vastly superior profit conversion compared to consumer electronics manufacturing.
This structural migration toward software-driven, recurring transactional volume has incrementally expanded Apple's overall consolidated gross margin profile from historic sub-38% baseline levels seen a decade ago to today's elevated 45%+ operational ceiling. The key question for macro trading desks remains: Can Services expansion outpace the component cost pressures looming over upcoming hardware iterations?
Verified Financial & Margin Metrics Breakdown
The comparative matrix below outlines key historical performance metrics, consensus targets, and operational segment dynamics across recent operational quarters:
| Segment / Financial Metric | Q4 FY23 Realized | Q3 FY24 Realized | Q4 FY24 Consensus Target | Strategic Outlook & Value Drivers |
|---|---|---|---|---|
| Consolidated Gross Margin | 45.2% | 46.3% | 45.8% - 46.4% | Driven by favorable product mix shifts and expanding Services baseline. |
| Hardware Gross Margin | 36.6% | 35.3% | 35.5% - 36.1% | Constrained by advanced 3nm wafer pricing and memory spot costs. |
| Services Gross Margin | 70.9% | 74.0% | 74.2% - 74.8% | Supported by high-margin licensing, app distribution, and cloud expansion. |
| iPhone ASP (Average Selling Price) | ~$895 | ~$910 | ~$925 | Mix shift toward premium Pro/Pro Max tiers mitigates baseline BOM cost inflation. |
| CapEx & AI Compute Allocation | $2.4B | $2.8B | $3.1B - $3.5B | Surging investment in specialized cloud compute architecture and private servers. |
Supply Chain Re-Engineering & Capital Allocation Context
Underpinning the gross margin equation is Apple’s ongoing structural realignment of its global supply chain. To reduce reliance on single-region assembly clusters and mitigate geopolitical risk exposure, the company has expanded manufacturing corridors across India, Vietnam, and Southeast Asia. While long-term supply chain diversification enhances corporate risk mitigation, the near-term operational ramp involves duplicate capital expenditures, localized training overhead, and initial logistics friction that temporarily weigh on unit cost structures.
Simultaneously, management’s capital allocation strategy remains under intense scrutiny. With an annual share buyback pace exceeding $90 billion and steady cash dividend distributions, Apple relies on powerful net balance sheet leverage to sustain earnings-per-share (EPS) growth even during periods of operational gross margin flatlining.
However, as artificial intelligence workloads transition from centralized data centers to edge compute paradigm execution, capital expenditure intensity is trending upward. Apple’s hybrid approach—processing lower-complexity context on-device while utilizing dedicated "Private Cloud Compute" data centers powered by custom Apple Silicon for complex tasks—aims to manage enterprise infrastructure overhead far more efficiently than hyperscale cloud competitors. If executed effectively, this architecture protects operating cash margins from the runaway CapEx burn currently pressuring peer balance sheets.
Industry & Market Implications: Winners vs. Losers
The broader ripple effects of Apple’s margin guidance extend across the entire global technology ecosystem, impacting asset classes, component suppliers, and rival original equipment manufacturers (OEMs):
Market Winners
- Advanced Semiconductor Foundry Ecosystems: Pure-play silicon fabricators with leading-edge nodes (such as TSMC) benefit from sustained pricing power, passing advanced packaging costs directly to tier-one fabless customers.
- Institutional Capital Allocators & Value Funds: Investors positioned in cash-generative, defensive mega-caps gain downside protection if Apple successfully demonstrates structural margin expansion via Services software leverage.
- High-Tier Memory Suppliers: Premium DRAM and enterprise storage providers capture elevated dollar-content per device as consumer expectations demand higher memory footprints for localized AI execution.
Market Losers
- Commoditized Hardware Suppliers: Secondary and tertiary component vendors facing aggressive procurement price negotiations as Apple works to offset rising silicon and assembly costs.
- Low-Margin Android OEMs: Rival smartphone manufacturers operating on razor-thin operating margins lack the high-margin Services substrate necessary to absorb component cost spikes without ceding market share or collapsing operational cash flows.
- Short-Term Growth Funds: Multi-asset portfolios exposed to tech equities without margin buffer visibility risk earnings-multiple contraction if consolidated hardware gross margins slip below the key 35% floor.
Frequently Asked Questions (People Also Ask)
Why are financial markets so focused on Apple's gross margin guidance?
Gross margin is the primary barometer of Apple’s underlying pricing power, supply chain efficiency, and structural profitability. Because Apple trades at a premium valuation multiple, any sign of gross margin compression indicates that component cost inflation, promotional discounting, or unfavorable product mix shifts are eroding earnings potential, which can trigger broader market sell-offs across technology indexes.
How does the Services segment directly cushion hardware margin contraction?
The Services segment operates at gross margins consistently exceeding 74%, compared to Hardware margins that hover between 35% and 37%. As Services revenue grows as a percentage of total enterprise revenue, it creates a positive mathematical shift in consolidated yields. This high-margin recurring income offsets rising component costs and localized pricing pressures in hardware manufacturing.
What role does component pricing play in hardware gross margin pressure?
Key component inputs—most notably advanced semiconductor nodes (such as 3nm wafers) and high-density DRAM/NAND memory components—constitute a major portion of the device bill-of-materials (BOM). When semiconductor foundries increase wafer prices or memory pricing cycles rebound, Apple’s hardware gross margins contract unless the company can pass those costs to consumers through higher ASPs or premium product mix shifts.
How do currency fluctuations and Greater China discounting impact corporate margins?
When the US dollar strengthens against foreign currencies, Apple’s international revenues translate into fewer dollars, compressing localized gross margins unless retail prices are adjusted upward. In competitive regions like Greater China, where local OEMs apply pricing pressure, adjusting retail prices upward can damp unit volume demand, forcing management to accept localized gross margin concessions or offer promotional discounts to defend market share.
Future Outlook & Strategic Milestones
Looking ahead, Apple's margin resilience will hinge on three decisive strategic catalysts over the next 12 to 18 months:
First, the commercial adoption curve of Apple Intelligence will serve as the ultimate test for device upgrade cycles. If localized AI features successfully drive widespread consumer monetization toward premium Pro Max tiers, hardware ASPs will expand sufficiently to absorb rising TSMC wafer packaging expenses.
Second, legal and regulatory scrutiny surrounding platform distribution fees—specifically European Union Antitrust enforcement under the Digital Markets Act (DMA) and US Department of Justice litigation—presents a structural tail-risk to Services gross margins. Any mandatory reductions in App Store commission structures or changes to search engine licensing agreements could impact high-margin Services revenue streams.
Third, long-term supply chain realignments in South and Southeast Asia must reach operational maturity to yield cost advantages comparable to historic concentration models. For institutional capital allocators, monitoring the balance between CapEx growth, component procurement strategies, and software monetization will remain the definitive framework for assessing Apple’s underlying equity value.