Executive Takeaways
Test Our Free AI & Tech Utilities Suite
Calculate LLM API token costs, analyze article dwell-time, or simulate tech DCA returns.
- Divergent Capital Allocation Models: While Apple leverages a self-sustaining ecosystem anchored by a 2.2-billion active device installed base and a high-margin Services division, Netflix remains shackled to a hyper-competitive, content-intensive capital expenditures treadmill requiring upwards of $17 billion annually in cash programming costs.
- Free Cash Flow Resilience: Apple generates over $100 billion in annual operating cash flow, allowing for unprecedented share repurchases ($90B+ annually) that systematically shrink float and boost earnings per share (EPS), whereas Netflix’s free cash flow yield remains highly sensitive to subscriber churn and global Average Revenue Per User (ARPU) fluctuations.
- Valuation Multiples vs. Margin Moats: Apple’s gross margins on Services (hovering above 74%) provide a high-visibility, annuity-like income stream that justifies its premium enterprise value multiples. Conversely, Netflix’s pivoting toward ad-supported tiers and password-sharing crackdowns underscores structural growth limits in saturated Western markets.
- The Definitive Investment Verdict: For institutional capital seeking superior risk-adjusted returns, risk mitigation, and structural downside protection in a elevated-interest-rate macro regime, Apple represents a pristine balance-sheet fortress, making it the clear allocation choice over Netflix.
The Macro Divergence: Ecosystem Lock-In vs. Single-Vertical Dependence
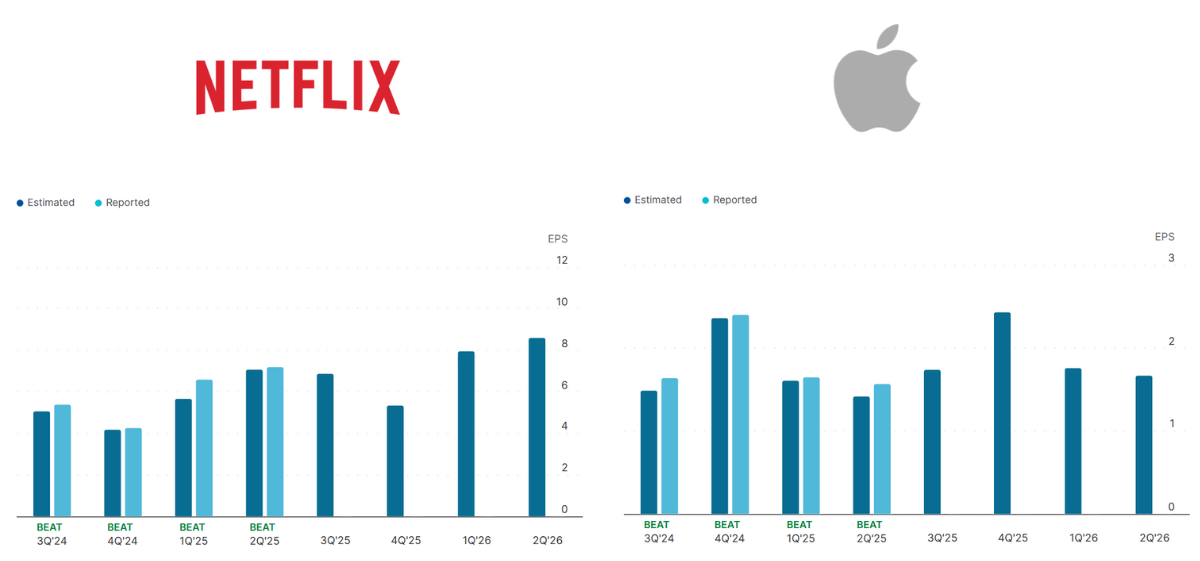
In the high-stakes arena of mega-cap technology investments, institutional portfolio managers are increasingly forced to distinguish between structural multi-product monopolies and single-vertical market leaders. As macro headwinds, persistent interest rate uncertainties, and shifting consumer discretionary spending recalibrate equity risk premiums, Apple Inc. (NASDAQ: AAPL) and Netflix Inc. (NASDAQ: NFLX) have taken drastically different capital trajectories.
Apple approaches historic record valuations, powered by an unmatched hardware-software feedback loop and a accelerating Services transition. In contrast, Netflix—despite intermittent tactical recoveries driven by password-sharing crackdowns and ad-supported subscription tiers—has struggled to maintain its peak hyper-growth valuation multiples, remaining significantly down from its historic operational peak relative to its tech peers.
The core divergence lies in fundamental capital efficiency. Apple operates a monolithic hardware matrix that doubles as an inescapable distribution platform for recurring third-party and proprietary services. Netflix, by comparison, operates strictly as a content platform that must continuously re-earn its audience’s subscription fee every 30 days. For Wall Street equity analysts and institutional risk committees, this distinction translates into vastly different free cash flow visibility and long-term Return on Invested Capital (ROIC).
The Anvil of Valuation Multiples: Apple’s Cash Fortress vs. Netflix’s Content Treadmill
1. The Margin Profile of Apple’s Installed Base
Apple’s structural competitive advantage resides in its hardware installed base, which recently breached 2.2 billion active devices globally. This ecosystem provides Apple with an captive distribution mechanism for Apple Music, iCloud, Apple Pay, Apple Care, and the App Store. The financial implications are profound: Apple’s Services division alone now generates annualized revenues exceeding $85 billion—a scale that rivaled Fortune 50 gross revenues—at gross margins consistently exceeding 74%.
This high-margin recurring fee structure shields Apple from the cost-inflation pressures sweeping the tech sector. Furthermore, Apple’s capital allocation strategy remains unmatched in financial history. Over the past decade, management has directed over $600 billion toward share repurchases, reducing total outstanding shares by nearly 35%. This relentless reduction in equity float acts as a permanent structural tailwind for earnings per share, providing an implied valuation floor even during cyclical hardware upgrade lulls.
2. Netflix and the Economics of Streaming Exhaustion
Netflix pioneered the Direct-to-Consumer (DTC) streaming architecture, but its core business model carries an inherent structural weakness: high subscriber acquisition costs (SAC) coupled with zero switching costs for consumers. To prevent subscriber churn and sustain net additions across North American and European markets, Netflix must maintain an onerous cash content spend budget, routinely eclipsing $17 billion annually.
Unlike hardware ecosystem players who monetize user engagement across multiple touchpoints (financial transactions, cloud storage, app distribution fees), Netflix’s revenue engine relies almost entirely on monthly subscription pricing power and nascent ad-tier monetizations. When content amortizations, global production inflation, and foreign exchange volatility are factored into net realization rates, Netflix’s free cash flow conversion rate remains significantly more volatile than Apple’s cash-generation machinery.
While Netflix’s pivot into dynamic ad-supported tiers and live events (such as NFL broadcast rights and WWE distribution partnerships) represents a logical strategic expansion, it fundamentally changes the nature of the stock. Netflix is evolving from a pure-play tech platform enjoying exponential network effects into a digitized, legacy-adjacent media conglomerate carrying heightened execution risks and lower long-term operating margins.
Verified Quantitative Metrics: Financial & Operating Comparison
The following institutional breakdown illustrates the stark divergence in financial balance sheet strength, margin profile, and capital allocation efficiencies between Apple and Netflix based on recent trailing twelve months (TTM) standardized financial data:
| Institutional Metric | Apple Inc. (NASDAQ: AAPL) | Netflix Inc. (NASDAQ: NFLX) | Strategic Market Implication |
|---|---|---|---|
| Active User Base / Installed Base | 2.2 Billion Active Devices | ~270 Million Paid Subscribers | Apple boasts an order-of-magnitude advantage in global monetization surface area. |
| Annual Operating Cash Flow | ~$110.5 Billion | ~$7.2 Billion | Apple generates unprecedented liquidity to fund R&D and capital returns simultaneously. |
| Services / Content Gross Margin | ~74.0% (Services Division) | ~43.5% (Overall Gross Margin) | Apple’s platform taxes yield far higher net revenue retention per dollar earned. |
| Annual Cash Allocated to Buybacks | $85B - $90B+ (Annual Target) | $2B - $6B (Opportunistic) | Apple’s continuous float reduction systematically forces EPS compounding over time. |
| Annual Content / R&D Spend | ~$30 Billion (R&D Enterprise) | ~$17 Billion (Cash Content) | Netflix spends capital on depreciating media assets; Apple invests in IP & custom silicon. |
| Enterprise Balance Sheet Cushion | ~$160 Billion Cash & Equivalents | ~$7 Billion Cash & Equivalents | Apple maintains unmatched balance-sheet liquidity and sovereign-tier debt ratings. |
Ecosystem Moats vs. Streaming Churn: The Institutional Analysis
From an institutional portfolio construction framework, capital preservation and predictability of cash flows are paramount. Apple’s competitive moat is protected by high consumer switching costs. A consumer embedded within the iOS ecosystem—utilizing Apple Watch health tracking, iCloud photo synchronization, Apple Card financing, and spatial compute hardware—faces exponential friction when attempting to migrate to an Android alternative.
Conversely, Netflix operates in a zero-friction cancellation environment. Consumer churn dynamics show that users regularly adopt a "subscribe, binge, cancel" cadence across streaming platforms. To counter this, Netflix has spent millions implementing complex account-sharing restrictions and price discrimination tiers. While these initiatives provide short-term average revenue per membership (ARM) spikes, they do not create a permanent structural moat.
Moreover, Apple’s strategic pivot toward on-device artificial intelligence (Apple Intelligence) and custom silicon architecture (M-series and A-series chips) positions the Cupertino giant at the epicenter of the consumer AI revolution. By running edge-AI models locally across its two-billion-device footprint, Apple commands a distribution bottleneck that AI software developers cannot bypass. Netflix enjoys no such technological hedge; it remains a consumer-facing endpoint subject to shifting culture, content fatigue, and rising utility infrastructure costs.
Industry & Market Implications: Who Wins and Who Loses?
The structural widening of the valuation gap between multi-product ecosystem platforms and single-vertical streaming operators has broad systemic consequences for tech capital markets:
- Mega-Cap Concentration in Indices: Institutional passive capital will continue flowing disproportionately into mega-caps with sovereign-grade balance sheets. Apple’s massive weight in the S&P 500 and Nasdaq-100 creates an ongoing buying bid driven by target-date and index funds, a tailwind single-digit weightings like Netflix cannot match.
- Consolidation of Pure-Play Streaming Platforms: As content production costs escalate alongside union wage adjustments and regional regulatory spending mandates, pure-play streaming networks will be forced into M&A activity. Sub-scale players will be absorbed, while scale players like Netflix will be forced to compete directly against deep-pocketed platform bundlers (Amazon Prime, Apple TV+, YouTube).
- R&D and Silicon Independence: Apple’s decades-long investment in proprietary silicon allows it to extract higher hardware gross margins while building custom hardware acceleration for emerging software workloads. Streaming platforms remain cloud infrastructure tenants, paying massive ongoing compute fees to third-party cloud service providers like Amazon Web Services (AWS) and Google Cloud.
Frequently Asked Questions (People Also Ask)
Why is Apple stock trading near record highs while media streaming stocks struggle?
Apple’s stock price is anchored by a highly diversified ecosystem revenue model, unprecedented corporate buyback programs, and expanding gross margins driven by its Services business. Streaming stocks like Netflix face structural margins compression, rising international content costs, subscriber churn, and intense competition from cash-rich tech platforms that use media content as a loss-leader to sell hardware or retail subscriptions.
Is Netflix’s ad-supported tier enough to close the valuation gap with Apple?
Unlikely over a multi-year horizon. While Netflix’s ad-supported tier unlocks price-sensitive demographic segments and creates a secondary advertising revenue stream, digital advertising markets are cyclical and heavily controlled by Alphabet, Meta, and Amazon. Ad-supported streaming does not give Netflix the pricing power, high-margin software tax, or ecosystem lock-in that Apple achieves across its hardware and services suite.
Which stock presents a safer capital allocation choice for institutional investors during a market correction?
Apple presents a significantly superior risk-adjusted profile for capital preservation. Apple holds over $160 billion in total cash and marketable securities, maintains a near net-neutral debt balance sheet policy, generates over $100 billion in predictable annual free cash flow, and regularly repurchases massive volumes of its own common stock. This provides a structural safety net during broader market sell-offs that a high-beta growth stock like Netflix lacks.
What are the key tail risks that could negatively impact Apple’s valuation trajectory?
The primary structural risks facing Apple include global regulatory antitrust scrutiny targeting App Store fee structures (such as the European Union’s Digital Markets Act and US Department of Justice litigations), supply chain concentration risks in East Asia, and potential geopolitical trade friction. However, Apple’s diversified manufacturing investments in India and Vietnam, combined with its unmatched ecosystem retention, significantly mitigate these operational risks relative to pure-play tech peers.
Future Outlook: Structural Milestones to Monitor
Over the next 12 to 24 months, institutional investors must track specific catalytic metrics to validate this relative value thesis:
For Apple, the key operational milestone will be the monetization velocity of edge-AI integrations across the iPhone upgrade cycle. If "Apple Intelligence" drives a multi-year hardware replacement supercycle while simultaneously expanding high-margin cloud services subscriptions, Apple’s free cash flow generation could comfortably exceed $120 billion annually, pushing equity valuations to new high-water marks.
For Netflix, the operational imperative centers on stabilizing global ARM without accelerating subscriber churn, alongside successfully monetizing live sports broadcasts and dynamic ad inventory. Should subscriber growth stall in saturated core regions or content acquisition costs outpace revenue expansion, Netflix risks re-rating lower toward standard media earnings multiples rather than premium tech enterprise valuations.
Final Institutional Verdict: When evaluating long-term risk mitigation, balance sheet durability, capital return efficiency, and structural moats, institutional capital allocation overwhelmingly favors **Apple**. In an economic landscape where cash flow certainty reigns supreme, Apple is the premier mega-cap tech asset to buy and hold.